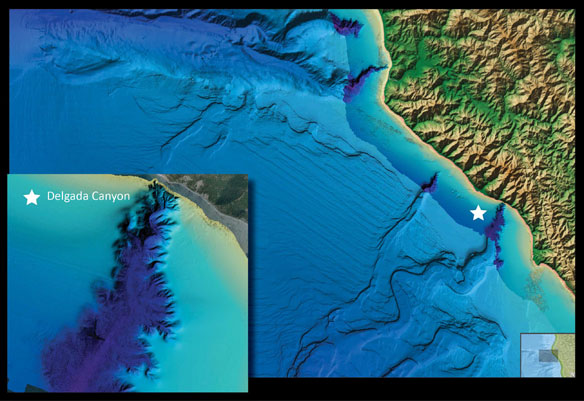

A view of Delgada Canyon offshore Northern California, as portrayed in NOAA’s new online viewer. NOAA
By NOAA
NOAA has made sea floor maps and other data on the world’s coasts, continental shelves and deep ocean available for easy viewing a href=” http://maps.ngdc.noaa.gov/viewers/bathymetry/”>online.
Anyone with Internet access can now explore undersea features and obtain detailed depictions of the sea floor and coasts, including deep canyons, ripples, landslides and likely fish habitat.
The new online data viewer compiles sea floor data from the near shore to the deep blue, including the latest high-resolution bathymetric (sea bottom) data collected by NOAA’s Office of Coast Survey primarily to support nautical charting.
“NOAA’s ocean bottom data are critical to so many mission requirements, including coastal safety and resiliency, navigation, healthy oceans and more. They are also just plain beautiful,” said Susan McLean, chief of NOAA’s Marine Geology and Geophysics Division in Boulder, Colo.
McLean’s division is part of NOAA’s National Geophysical Data Center, responsible for compiling, archiving and distributing Earth system data, including Earth observations from space, marine geology information and international natural hazard data and imagery. NGDC’s sea floor data have long been free and open to the public in original science formatting, but that often required the use of specialized software to convert the data into maps and other products.
“For serious scientists, the new viewer allows an important preview capability that will help speed data access and analysis. But its real power is exposing a new audience to NOAA data,” said LCDR Dan Price, bathymetric program manager at NGDC. “I showed the new viewer to my neighbors and they were blown away by the detail and features revealed.”
The new interface makes exploration easy and intuitive, using a “color-shaded relief” technique to depict bathymetric data and derived maps and models. For example, a user can zoom into Delgado Canyon, one of a series of deep canyons off the northern California coast between Fort Bragg and Eureka. The sea floor descends steeply from shallow yellows into dark blues and purples.
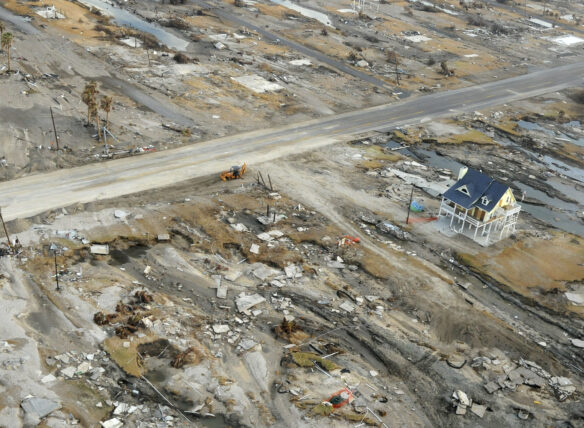
“These are critical data for modeling coastal flooding, from tsunami to hurricane storm surge,” said Kelly Carignan, a digital elevation modeler at NGDC.
NOAA’s latest sea floor data, Office of Coast Survey gridded bathymetry data, are archived and displayed in the new viewer through an open source file format known as BAG (Bathymetry Attributed Grid), developed by the Open Navigation Surface Working Group.