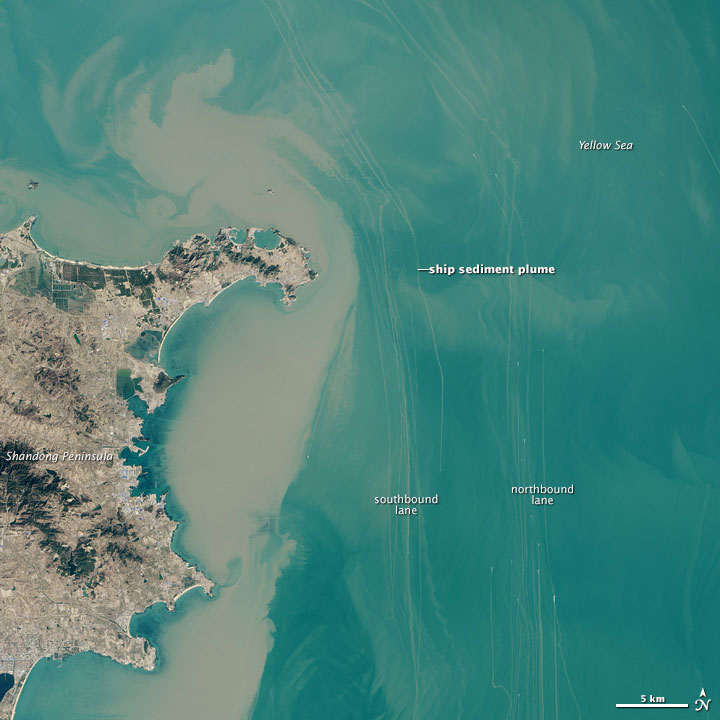

NASA Earth Observatory image by Jesse Allen, using Landsat data from the U.S. Geological Survey.
By NASA / Earth Observatory;
The oceans may be vast, yet they still can grow crowded. Some congested areas have enough ship traffic that the International Maritime Organization (IMO) and other groups maintain traffic separation schemes—the equivalent of highways for ships—to reduce the risk of collisions.
The Operational Land Imager (OLI) on Landsat 8 captured this view of northbound and southbound shipping lanes off the coast of China’s Shandong Peninsula on February 24, 2015. The lanes form one of the main routes from the Yellow Sea into the Bohai Sea and the Chinese ports of Dalian and Tianjin, two of the busiest in the world. As shown by this map, several lanes of traffic intersect northeast of the Shandong Peninsula.
The vessels in this image are most likely cargo ships, though some may be ferries or fishing boats. The ships appear as small gray and white specks. (Click on the image for a closer view.) In the shallow coastal waters, their propellers kick up long, brown sediment plumes. Most of the northbound ships make a turn to the northwest as they round the tip of Shangdong.
According to the IMO, the practice of following predetermined routes for shipping originated in 1898. It was first adopted by shipping companies operating passenger ships across the North Atlantic. Since then, traffic separation schemes have been established in most congested areas, causing the number of ship collisions and groundings to drop dramatically.
But with upwards of 86,000 merchant ships on the world’s sea, accidents still happen. On May 2, 2010, the Bright Century, a cargo ship loaded with 170,000 tons of iron ore, sank after it collided with a freighter about 37 kilometers (23 miles) east of Shandong Peninsula. In December 2012, a fishing boat collided with a cargo ship near the peninsula and sank with 11 fisherman on board.
Original Article, NASA / Earth Observatory
Worldwide Ship Traffic Up 300 Percent Since 1992, AGU (11-29-2014)
China’s Growth Fuels Boom in World Shipping Traffic, National Geographic
The study reveals that ship traffic—and the environmental impact that goes with it—has been booming even faster than the volume of international trade…
The Prevention and Control of Shipping and Port Emissions in China, NRDC (10-28-2014)
China is home to seven of the world’s ten busiest container ports. About 26 percent of the world’s containers pass through the top ten Chinese ports every year. Every ship and truck brings pollution along with its cargo, and China is paying a high price for pollution from shipping…
Super-sized ships: How big can they get? Independent UK (10-20-2014)
Despite the physical limits and risks, ships of more than 450m are anticipated within the next five years…
Thousands Of Containers Fall Off Ships Every Year. What Happens To Them? Huffington Green (07-17-2014)
It is estimated that thousands of containers are lost every year along international shipping routes due to big waves or wind gusts. Sometimes they wash up on shore, but what happens to the containers that land at the bottom of the sea? No one really knew.
Breaking Bad on the Beach, NASA / Earth Observatory (09-28-2014)
Tens of thousands of ships ply the world’s oceans, bays, and rivers. But what happens when those ships have become too old or too expensive to operate? In most cases, they end up on the shores of Asia…literally.