
By Michael Carlowicz / NASA
Trees cool and moisten our air and fill it with oxygen. They calm the winds and shade the land from sunlight. They shelter countless species, anchor the soil, and slow the movement of water. They provide food, fuel, medicines, and building materials for human activity…
Scientists estimate that humans release about nine billion tons of carbon (mostly carbon dioxide) each year by burning fossil fuels and by changing the landscape. About four billion tons end up in the atmosphere and two billion tons dissolve in the ocean. The last three billion go into ecosystems on land, but exactly where these sinks are located remains an open question.
Forests are considered one of the world’s largest banks for all of the carbon emitted into the atmosphere through natural processes and human activities. They cover about 30 percent of Earth’s land surface, while accounting for 50 percent of plant productivity. As much as 45 percent of the carbon stored on land is tied up in forests.
Did forests hold more or less carbon in the past? Could they store more in the future? Scientists really don’t know exactly how much carbon our forests can hold.
What they do know is that human activities have moved a lot of carbon from long-term, stable storage—such as rocks, buried fossil fuels, and old-growth forests—into forms with short-term, direct impacts on the environment. For instance, when we clear forests, we remove tall trees that can store carbon in their trunks, branches, and leaves for hundreds of years. We often replace them with croplands or pastures that store less carbon for a shorter time. Paved developments store little to no carbon.
“The biggest natural sink of terrestrial carbon lies in our forests and trees,” says Steve Running, a forest ecologist at the University of Montana. “And the biggest natural source of carbon on land is also the forest. So one of the most important things we can do for understanding the carbon budget is to get a better inventory of the carbon we have in our trees.”
The key measurement is biomass, or the total mass of organisms living within a given area. A rule of thumb for ecologists is that the amount of carbon stored in a tree equals 50 percent of its dry biomass. So if you can estimate the biomass of all the trees in all the forests, you can estimate how much carbon is being stored on land. Repeating those measurements over years, decades, and centuries would then help us understand how carbon is moving around the planet.
Trees are often held up as a solution to our carbon budget problem. Making something like an economic argument, some people suggest that we can “grow” our way out of trouble by making (or keeping) the landscape greener. But would it help to plant more trees? To cut down fewer? And does it matter where those trees are?
The first step toward answering those questions is to figure out just how much carbon our trees store right now.
Climate Change Killing Alaska’s Yellow Cedars, AP
The U.S. Forest Service has confirmed climate change is killing yellow cedars, an ecologically and economically valuable tree, in the Alaskan Panhandle…
Haiti’s Unnatural Floods
The nearly complete deforestation of Haiti has caused countless problems for the country, the people, and its biodiversity.
A Giant Brought to its Knees: The Atlantic Coastal Forest
It’s the most threatened rainforest in Brazil, a global biodiversity hotspot, and contains around one in 12 of all species on the planet. We must be talking about the Amazon, right? Wrong. It’s the Atlantic Forest, which used to run in a continuous strip along the 2,000 miles of Brazil’s eastern seaboard, up the steep coastal mountain slopes and, in places, far into the interior, reaching parts of Paraguay and northern Argentina. But the story of the Atlantic Forest does not end at the tide line. Its influence extends well out into the coastal waters of Brazil, as the nutrients from the forest flow into the estuaries and bays to form rich feeding grounds for a wide variety of marine creatures.
Closeup on the Coastal Forests of the Pacific Northwest: NASA Earth Observatory
By Mike Carlowicz / NASA

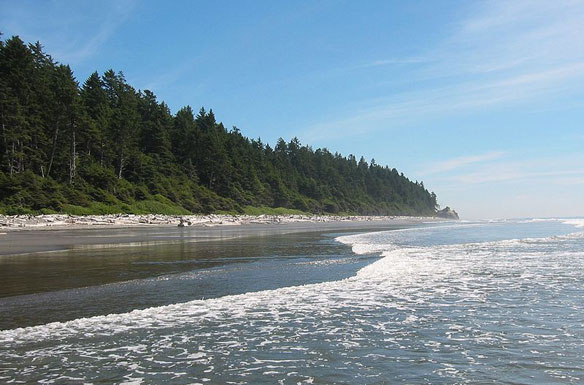
Rain forest along Olympic Coast, Oregon. The Pacific temperate rain forests ecoregion of North America is the largest temperate rain forest ecoregion on the planet as defined by the World Wildlife Fund. Photo source: ©© Dominio Público
The coastal Pacific Northwest of the United States has the tallest trees in North America, averaging as much as 40 meters (131 feet) in height. It has the densest biomass—the total mass of organisms living within a given area—in the country. But for centuries, it also has been a much-tapped resource for lumber; land-clearing for agriculture and development have also trimmed the woodlands. Both the lumber companies and forest managers have an interest in measuring the health of these forests.
“Resource managers need to see forests down to the disturbance resolution—the scale at which parking lots or developments or farms are carved out,” says Josef Kellndorfer, an ecologist at the Woods Hole Research Center (WHRC). His research team recently took forest mapping down to that level when they released the National Biomass and Carbon Dataset (NBCD) in April 2011. “We are providing information on a management scale.”
The maps above are a subset of that nationwide mapping project. The top map shows one of 66 mapping zones across the country; in this case, Washington state and a sliver of Oregon. The inset map (lower) shows the fine scale of that forest (the image is roughly 20 kilometers wide), which allows researchers to see the regular patterns of logging and development, and the more erratic shape of areas lost to fires and pests.
Over six years, researchers assembled the maps from space-based radar, satellite sensors, computer models, and a massive amount of ground-based data. Forests were mapped down to a scale of 30 meters, or roughly 10 computer display pixels for every hectare of land (4 pixels per acre). The colors depict the concentration of biomass stored in the trunks, limbs, and leaves of trees. The darkest greens reveal the areas with the densest, tallest, and most robust growth.
A rule of thumb for ecologists is that the amount of carbon stored in a tree equals 50 percent of its dry biomass. So if you can estimate the biomass of all the trees in the forest, you can estimate how much carbon is being stored. If you keep tracking it over time, you can know something about how much carbon is being absorbed from the atmosphere or lost to it.
Human activities have moved a lot of carbon from long-term, stable storage—such as the tall old-growth forests of the Pacific Northwest or the lower, denser stands of the Amazon—into forms with short-term, direct impacts on the environment. When we clear forests, we usually remove tall trees that can store tons of carbon in their trunks, branches, and leaves for hundreds of years. We replace them with croplands or pastures that store less carbon for a shorter time. And paved developments store little to no carbon.
In a recent report by the U.S. Forest Service, researchers noted that while the federal government owns slightly less than 50 percent of the forest land in the Pacific Northwest, it controls more then 67 percent of the old-growth in the region. That percentage is rising not because of new federal acquisitions, but because harvesting removed about 13 percent (491,000 acres) of old- and “late-sucessional” forest on non-federal lands. (The main reason for old-growth loss on federal lands is forest fire.)
“The biggest natural sink of terrestrial carbon lies in our forests and trees,” says Steve Running, a forest ecologist at the University of Montana. “And the biggest natural source of carbon on land is also the forest. So one of the most important things we can do for understanding the carbon budget is to get a better inventory of the carbon we have in our trees.”


