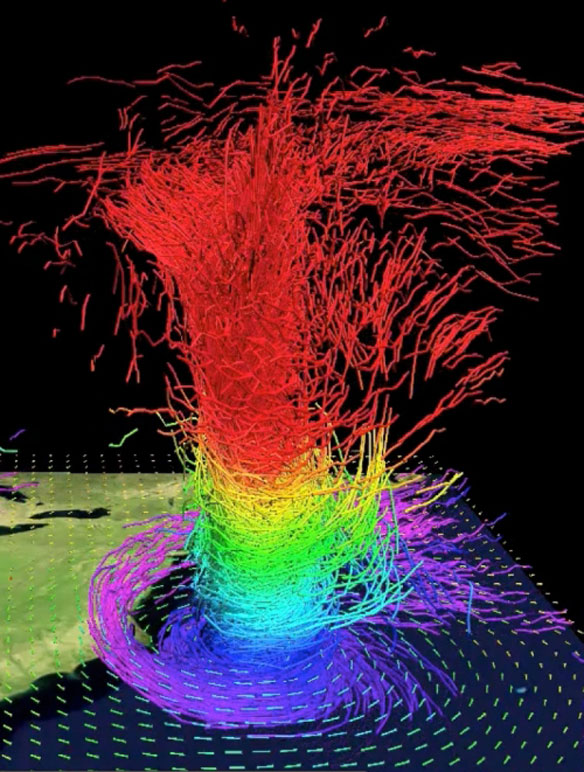
In this 3-D map of potential temperature, relatively cool air wraps around Sandy’s core near the surface (purple and blue colors), while air parcels gain heat from moisture condensing into clouds and precipitation as they ascend through the storm’s core. Captions and Image: © UCAR. Image courtesy Mel Shapiro, NCAR.
Excerpts;
Scientists have recently developed awe-inspiring visualizations of Hurricane Sandy, which devastated parts of the U.S. East Coast last year. The visualizations, created using state-of-the-art computer models at the National Center for Atmospheric Research (NCAR), provide some of the most detailed looks at any hurricane to date…
View Original Images and Learn More: © UCAR /NCAR
New Views Of Sandy: High-resolution models shed light on 2012 disaster, NCAR / UCAR