In addition to the graphics – maps and animations – and explanatory text, the collection of videos captured by residents is particularly successful in communicating the magnitude of the impacts.
Excerpt:
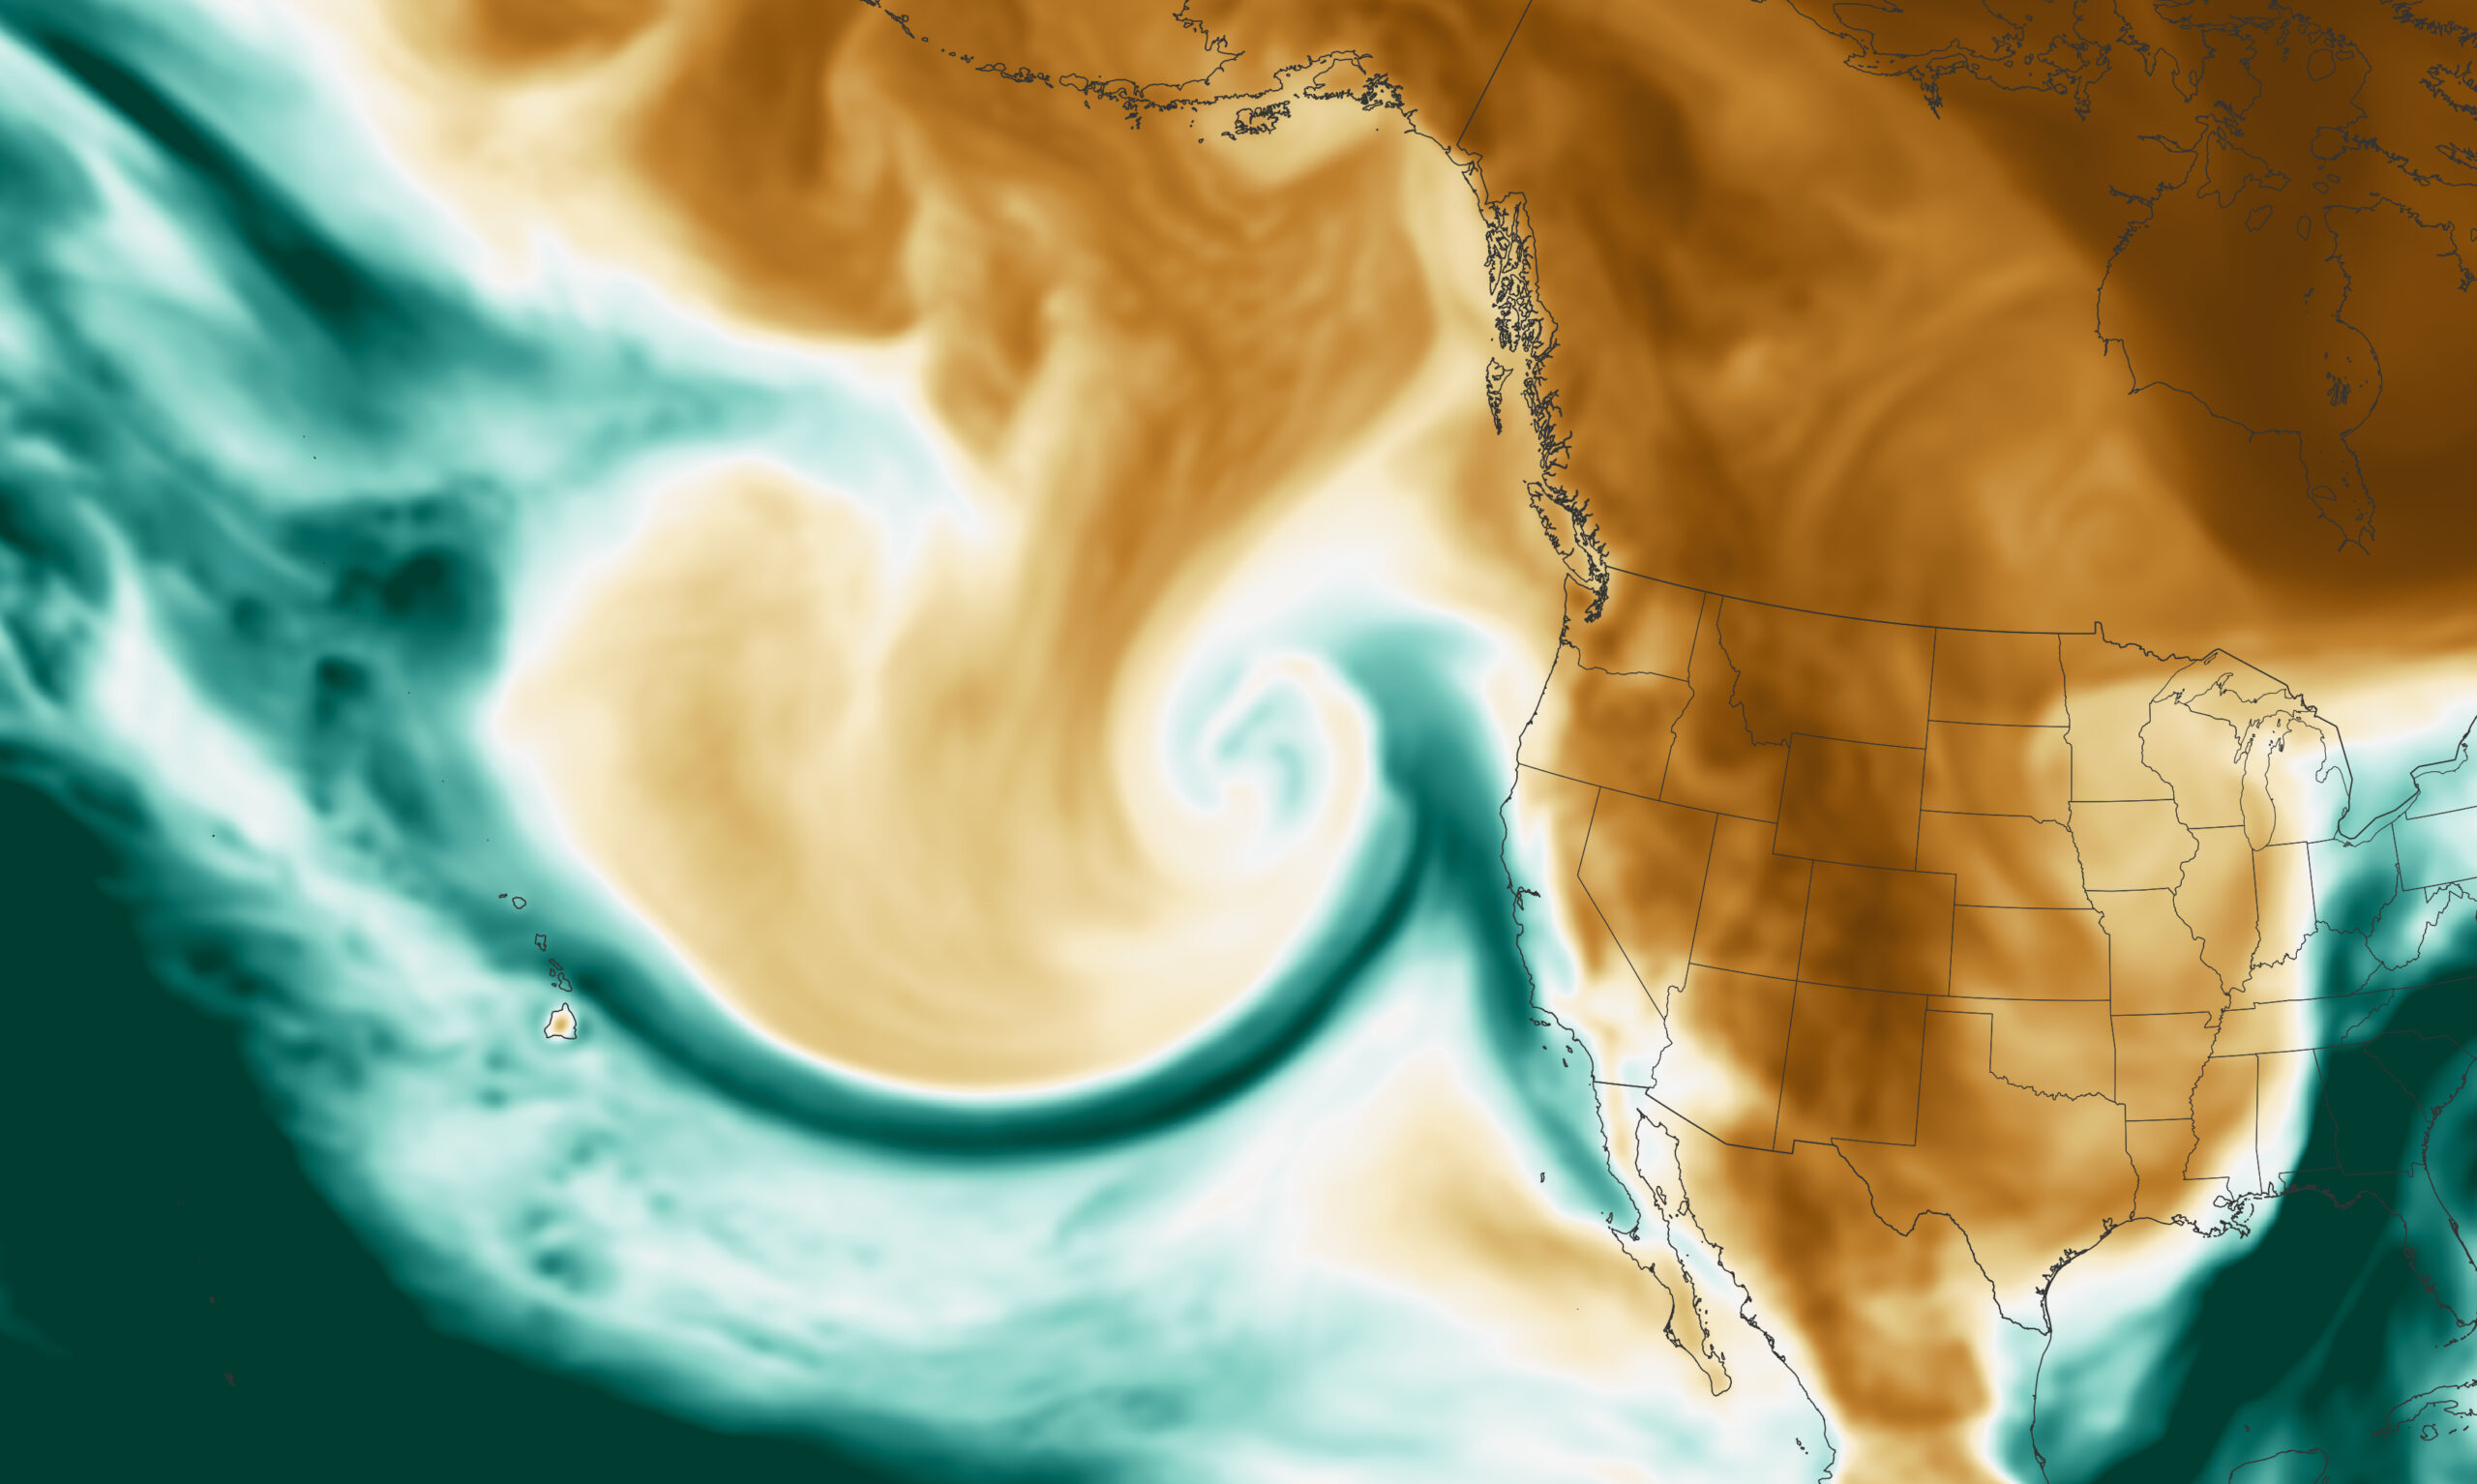
A parade of storms known as atmospheric rivers has dumped massive amounts of rain and snow on California since late December. The storms have produced deadly flooding, crippling snow, dangerous mudslides, severe thunderstorms and tornadoes.
Atmospheric rivers funnel extreme amounts of moisture over the oceans into narrow bands of clouds. As these clouds are transported over land, they can produce many hours of intense rain and snow.
Precipitable water is an indicator of how much moisture there is in the atmosphere. Higher values of precipitable water correspond to greater potential for heavy rain or snow. The animation of precipitable water forecast above, which spans Jan. 9 to 23, shows the parade of multiple atmospheric rivers lashing California with repeated rounds of heavy rain and snow…