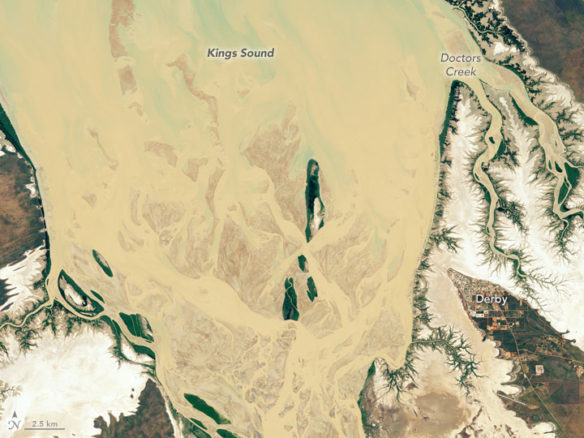
Acquired May 12, 2017. NASA Earth Observatory images by Jesse Allen, using data provided by Stephen Sagar (Geoscience Australia) and the U.S. Geological Survey.
By Laura Rocchio, Landsat Science Outreach Team, NASA / Earth Observatory;
It is one of the marvels of the shore: the daily rhythm of the beach growing and shrinking with the changing tide. That beguiling strip of land revealed by low tide and concealed by high tide is known as the intertidal zone. It is beguiling to scientists, too.
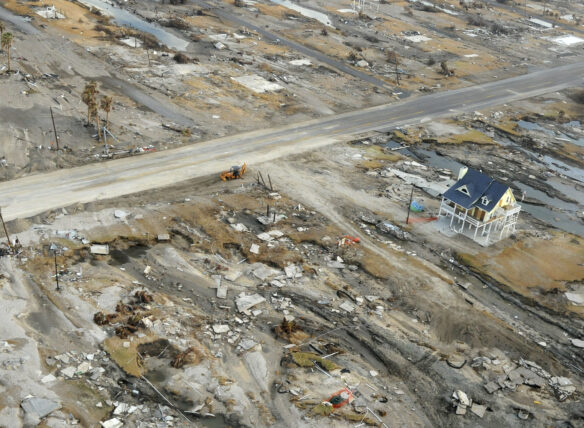
The intertidal zone is home to rich ecosystems that provide habitat for migrating shorebirds and nurseries for marine life. In many places, the intertidal zone is filled with salt marshes or mangroves, which also provide a first line of defense against extreme storms.
To safeguard the benefits provided by the intertidal zone, coastal resource managers need reliable tidal extent maps. The need grows more urgent with the pressures of sea-level rise and land reclamation. But surveying this ephemeral landscape is difficult, especially when mapping large expanses of shoreline. A new and innovative automated mapping approach is changing that.
Using 28 years of Landsat data, an Australian research team has created an intertidal zone map for the entire Australian coast—some 50,000 kilometers (30,000 miles). The resulting product, dubbed the Intertidal Extents Model, or ITEM, is now available online.
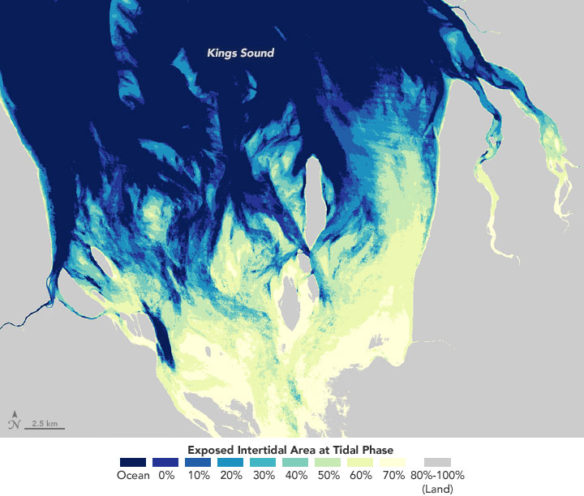
Acquired 1987 – 2015. NASA Earth Observatory images by Jesse Allen, using data provided by Stephen Sagar (Geoscience Australia) and the U.S. Geological Survey.
The image above shows an ITEM tidal extent map for Kings Sound, on Australia’s northwest coast. The sound’s massive tidal range is second only to that of the Bay of Fundy. Lighter shades show areas that are often exposed, while the darker shades indicate areas that are only above water at low tide. The darkest shade signifies perpetually submerged areas.
Stephen Sagar of Geoscience Australia led the ITEM effort, which was made possible by Landsat’s deep archive, Geoscience Australia’s repository of Landsat reflectance data, and an innovative data analysis approach. Sagar and his team used analysis-ready Landsat data going back to 1987. The collection of more than 200,000 coastal Landsat scenes enabled them to make tidal extent maps even for locations where cloud cover is a problem (such as ecologically important Roebuck Bay and the Kimberley Coast).
To make the maps, Sagar’s team added a tidal stage attribute to the dataset; that is, they tagged each Landsat scene with information about whether the tide was high, low, or somewhere in between. They then sorted all of the images into nine tidal stages and used a “wetness index” to determine if each Landsat pixel location was typically wet or dry at that tidal stage. The first continent-wide tidal extent map for Australia was created by combining those nine resulting wet/dry maps.
Since tidal extent is related to both the tidal range and the shoreline elevation, the dataset provides information about relative topography and coastal elevation. This has allowed ITEM to make meaningful contributions to the Northern Australian 100-meter bathymetry grid, a water depth chart for the region.
“ITEM has been able to provide topographic and elevation information in a remote region of Australia characterized by large tidal ranges and extensive intertidal regions,” said Sagar. “Many of these regions were previously unmapped.”
The methodology behind this mapping breakthrough could be replicated to map other coasts around the world.
Original Article And Learn More, NASA / Earth Observatory (06-16-2017)