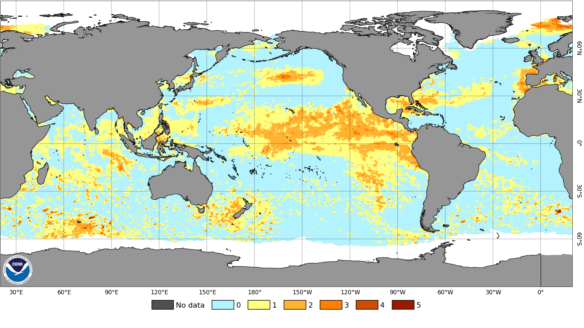
The entire planet is feeling the effects of a warming atmosphere and ocean, from Sudan to Siberia, and we are way passed denial or debate. Whether forest and brush fires, or droughts and water shortages, we are all in this together and we need to continue to take the steps needed now to get off of fossil fuels and move to renewables as fast as humanely possible. I think of action in terms of sober optimism and aggressive incrementalism.
All of us at one time or another have no doubt experienced the unpleasant surprise of opening up the car door on a very hot day, a car with the windows rolled up nice and tight, and having the sometimes-painful experience of sitting down on a very hot seat and grabbing onto a very hot steering wheel. Simply put, this is the greenhouse effect. It occurs because of some fairly basic physics.
When sunlight or short wavelength solar radiation enters your automobile through the windows, no matter what kind of car you drive, it warms up the interior – the seats, dashboard, and steering wheel. As they warm, they give off long wave back radiation, which cannot pass through the windows, so your car heats up. In fact, it can heat up a lot and it is not a safe place to leave small children or pets. Glass houses, where lots of winter vegetables are grown, as well as many cut flowers locally, benefit from the same greenhouse effect.
Certain molecules in the atmosphere, mostly carbon dioxide, methane, nitrous oxide, and certain fluorinated gases, create the same greenhouse effect for the Earth. Incoming solar radiation from an astonishing 93 million miles away, warms the Earth’s surface, which then emits long-wave back radiation into space; but these particular molecules act like the glass windows in your car and trap that back radiation. This warms up the planet.
These molecules all occur naturally in the atmosphere, and we should all be thankful for their presence. As a result of these natural greenhouse gases, the average global temperature prior to the industrial revolution, was about 56° Fahrenheit. Without these greenhouse gases, our average global temperature would be much colder, about 0° Fahrenheit, making the planet a much less comfortable habitat for us humans.
With the advent of the Industrial Revolution, which started with the burning of coal but which soon included oil and natural gas, the amount of greenhouse gases in our atmosphere, dominated by carbon dioxide and methane, slowly began to increase. The natural or pre-industrial amount of carbon dioxide in the atmosphere fluctuated between about 175 and 275 parts per million over the past 800,000 years. You might reasonably ask, how in the heck do we know this?
These measurements were taken from ice cores collected from Antarctica that have been recovered by drilling down to a depth of over 11,000 feet and that extend back over 800,000 years. As snow falls and accumulates, air is trapped within the snow and when the snow is converted to ice, these molecules of ancient atmosphere are preserved. Scientists have now collected thousands of feet of cores of this preserved ice. Using mass spectrometers the carbon dioxide content of the preserved air bubbles can be measured quite precisely.
Other scientists have been monitoring the amount of carbon dioxide in the atmosphere since 1958 on the top of Moana Loa in Hawaii, where there is no industrial contamination. The concentration of atmospheric carbon dioxide continues to increase and is now at 417 parts per million, or about a 50% increase over natural pre-industrial levels.
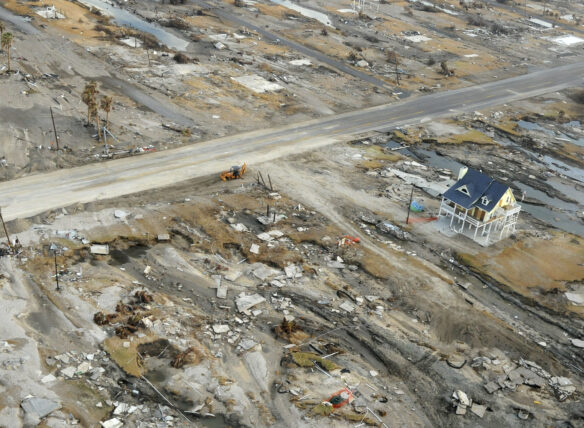
Just like the inside of your car warms up on a sunny day with the windows closed, the planet is continuing to warm with all of the side effects we regularly read about and experience – rising temperatures and more frequent droughts and forest fires, melting ice and rising sea levels, to name a few. While there are a number of sources of atmospheric carbon dioxide (including forest fires and the manufacturing of cement), the largest is the burning of fossil fuels – coal, oil and gas – which account for 92% of total U.S. human carbon dioxide emissions.
While the U.S. makes up just 4.2% of the global population, we generate 12.6% of the total anthropogenic carbon dioxide emissions. Although we were the planet’s largest contributor for many years, China has moved into that dubious spot, and emits nearly 32% of the global total. China burns a lot of coal and makes a lot of cement. China and the U.S. are followed by India, Russia and Japan.
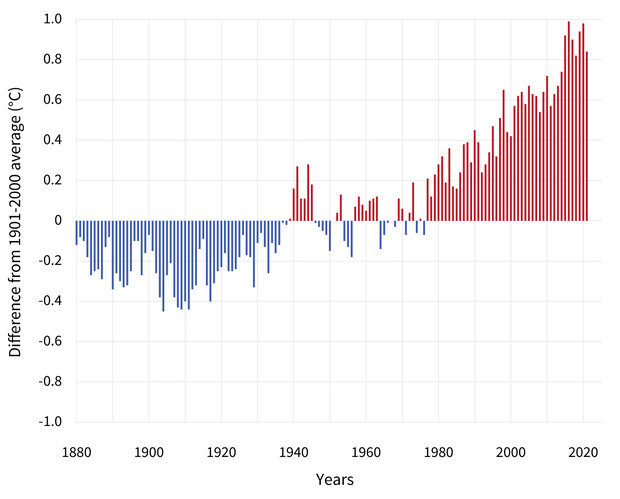
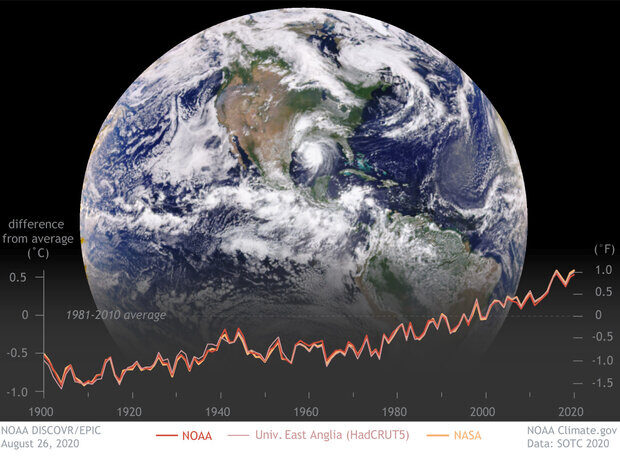
Our global carbon dioxide emissions continue to increase and global temperatures continue to rise in response. The ten warmest years on record since we began keeping track of global temperatures in 1880 have all occurred since 2005. This is not good for the planet, not good for us, or our children or grandchildren. The only feasible way to begin to halt this continuing warming is to eliminate our dependence on fossil fuels and move to renewables as quickly as possible. The science is clear and the time for debating is over. We need to move now and we need to move fast.