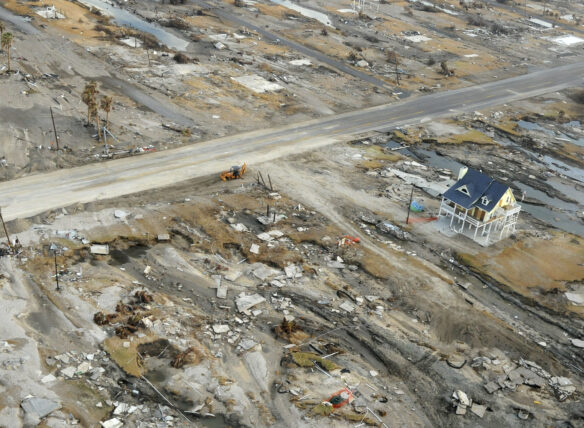
Ortley Beach and Lavallette, NJ. Aerial pictures of New Jersey’s coast, after superstorm Sandy devastated the area. Photo courtesy of: © Program for the Study of Developed Shorelines (PSDS) / WCU
By USGS;
A new study that looked in part at how damage estimates evolve following a storm puts the total amount of building damage caused by Hurricane Sandy for all evaluated counties in New York at $23 billion. Estimates of damage by county ranged from $380 million to $5.9 billion.
The U.S. Geological Survey study, done in cooperation with the Federal Emergency Management Agency, marks the first time the agency has done this type of analysis and cost estimation for a coastal storm.
“We looked at how estimates of building damage change depending on the amount of information available at the time of the estimate, looking at three time periods — storm landfall, two weeks later, and then three months later,” said Chris Schubert, a USGS hydrologist and lead author of the study. “What we found was that the biggest jump in estimate reliability comes between the initial estimate and the two-week mark, but that the additional information available three months after an event greatly help refine the estimates even further.”
The USGS researcher called the study a “proof of concept” that really showcased the value of gathering storm data before and after a storm.
“FEMA funded the sensor placement we did prior to the storm and our assessment of how high the water reached after the storm,” Schubert said. “The results from this new study demonstrated how the additional resolution and accuracy of flood depictions resulting from these efforts greatly improved the damage estimates.”
Damage estimates can be used by FEMA and other stakeholders to help prioritize relief and reconstruction efforts following a storm. The results can also assist with resiliency planning that helps communities prepare for future storms.
The researchers came up with the estimates by using census data and FEMA’s HAZUS modeling software program. The HAZUS program is used to estimate potential loss from disasters such as earthquakes, wind, hurricanes and floods. This program allows for an assessment of building loss on a block-by-block level.
Hurricane Sandy’s impact was the first time in recent memory, and record, that coastal water levels had reached the heights they attained in many places in the state of New York. Flood effects of Hurricane Sandy, in comparison to those from Tropical Storm Irene in 2011, were significantly more extensive, with most water levels rising at least 2.5 feet higher than in the 2011 storm.
With the latest USGS analysis, a comprehensive picture of the magnitude of Sandy’s impact is now available. Without the sensor placement before the storm, and assessment of high-water marks after, this level of understanding wouldn’t be possible.
“This is the first time USGS has done this type of analysis and cost estimation for a coastal storm,” said Schubert. “The effort incorporates what we learned from previous storms going back to Katrina, and the storm-tide information we provided to FEMA in the immediate aftermath of Sandy is one of the building blocks for this research. The additional fidelity of the damage estimate underscores the tremendous value of the dataset for this storm.”
Interpretation of storm-tide data from a variety of tools such as tide gauges, stream gauges, and temporary sensors combined with high-water marks showed the extreme nature of storm-tide flooding and, at some sites, the severity and arrival time of the storm surge. Storm surge is the height of water above the normal astronomical tide level due to a storm. Storm tide is the storm surge in addition to the regular tide.
“Timing matters, though every storm is different,” said Schubert. “Throughout southeastern New York, we saw that timing of the surge arrival determined how high the storm tide reached. The worst flooding impacts occurred along the Atlantic Ocean-facing parts of New York City and western Long Island, where the peak storm surge arrived at high tide. So the resulting storm tide was five to six feet higher than it would have been had the peak surge arrived at low tide.”
The new research is available online in, Analysis of Storm-Tide Impacts from Hurricane Sandy in New York, SIR 2015-5036, by C.E. Schubert, R. Busciolano, P.P. Hearn Jr., A.N. Rahav, R. Behrens, J. Finkelstein, J. Monti Jr., and A. E. Simonson. It examined damage estimates from those counties with depictions of flood extent available from FEMA and the National Hurricane Center.
The USGS is also conducting a study in New Jersey that examines similar topics, including the estimated flood frequency of documented peak storm-tide elevations, comparisons of Sandy to historic coastal storms, the timing of storm surge, and changes in HAZUS damage estimates with the use of USGS sensor and high-water-mark data. That study is expected to be completed and released later this year.
Sandy Reminds Us of Coastal Hazards, by Pr. Robert Young
Hurricane Sandy Relief Bill Fails to Face Coastal Realities, by Robert S. Young,
Rebuilding the Shores, Increasing the Risks, The New York Times (04-2013)
After Hurricane Sandy, One Man Tries To Stop The Reconstruction, Outside Magazine