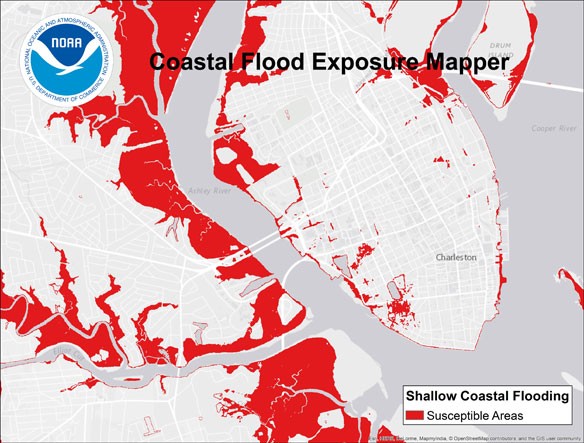
Charleston, South Carolina, was found to be one of the top ten U.S. cities in increased nuisance flooding, according to a June 2014 NOAA report. The Coastal Flood Exposure Mapper enables users to visualize these flood impacts and others in order to craft better resilience plans.”. (Image: NOAA)
By NOAA;
A NOAA flood exposure risk mapping tool that was developed in New York, New Jersey, Delaware and Pennsylvania has now been expanded to cover coastal areas along the entire U.S. East Coast and Gulf of Mexico. The Coastal Flood Exposure Mapper, a deliverable of President Obama’s Climate Action Plan, provides users with maps, data, and information to assess risks and vulnerabilities related to coastal flooding and hazards.
According to the 2010 U.S. Census Bureau population count, 39 percent of the U.S. population lives in counties subject to significant coastal flooding.
“Coastal populations are increasing, as is the potential for flood events,” said Jeffrey L. Payne, Ph.D., acting director of NOAA’s Office for Coastal Management. “Anything we can do to make people aware of their community’s vulnerability puts that community in a better position to act to save lives and property.”
With this NOAA tool, users select their location and the flood scenario of their choosing: Federal Emergency Management Agency flood designations, shallow coastal flooding associated with high tides, or flooding associated with sea level rise or storm surge. Flood maps are then overlaid with any of three exposure maps to show how floodwaters might impact area assets. All maps can be saved, printed, and shared.
- The societal exposure map provides information on population density, poverty, the elderly, employees, and projected population growth. Communities can use this information for community planning and to determine how floodwaters might affect vulnerable or concentrated populations.
- Roads, bridges, water, and sewer systems can be damaged by coastal flooding. Communities can use the mapper to assess infrastructure vulnerabilities and associated environmental and economic issues to determine what steps are needed to protect these assets.
- The ecosystem exposure map provides data and information about natural areas and open spaces—including their proximity to development — to help communities identify which areas can be conserved for future flood protection benefits. Pollution sources are also identified to show where natural resources could be affected during a flood.
Coastal communities around the country are becoming more vulnerable to severe events and water inundation,” said Holly Bamford, Ph.D., acting assistant secretary of commerce for conservation and management.
“According to the 2010 U.S. Census, the population of coastal communities is going to rise by 8 percent by 2020. Increased vulnerability plus increased population means communities are going to need accurate, reliable, and timely information to prepare for the future. Equipping our communities with information, products, services, and tools, like the Coastal Flood Exposure Mapper, allows them to become more resilient.”
This map tool was developed by the NOAA Office for Coastal Management.
Original Article and Learn More, NOAA
New Interactive Storm-Surge Map Helps Residents See Potential Flood Risks, IP (04-08-2015)