Excerpt:
More than $15 billion, mostly federal dollars, have been spent moving sand to the shoreline for both recreational and shoreline protection benefits. Still, whether in New Jersey, New York, North Carolina, Florida, or California, the life span of the sand added artificially to these beaches in many cases has been relatively short and in some instances has been less than a year…
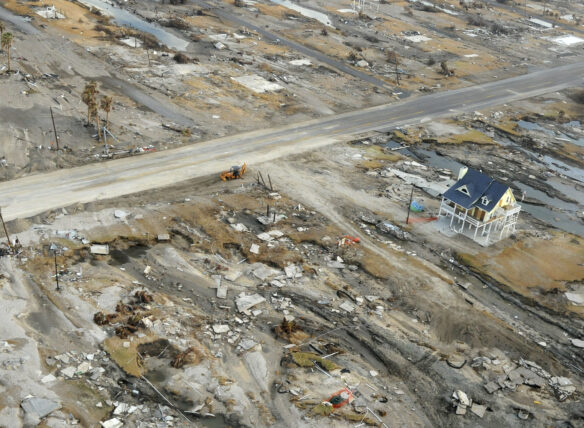
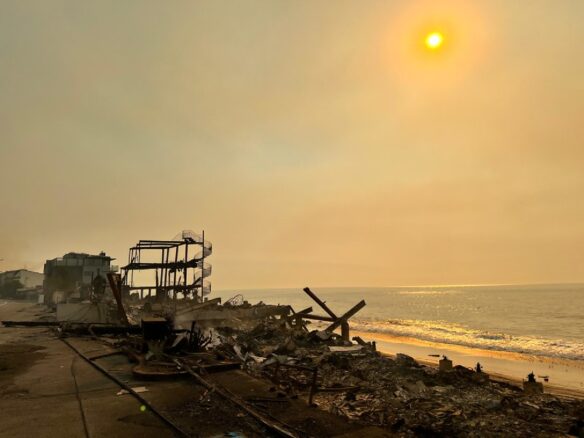
Most U.S. coastlines, whether low-relief beaches, dunes, and barrier islands or higher relief bluffs and cliffs, are undergoing recession, albeit at differing rates, which has threatened, damaged, and destroyed both public infrastruc- ture and private development. Causal factors for this increas- ing recession include a reduction of natural sand supplies, trapping or diversion of sand because of large coastal engi- neering structures, encroachment of development onto the shoreline, land subsidence, long-term sea-level rise, and short-term extreme events, including hurricanes and severe storms with the simultaneous arrival of large waves and extreme high tides.
However, responses to shoreline erosion or recession are limited. They include armoring of one type or another, beach nourishment, and relocating buildings and infrastructure away from the edge. Along the United States’ west coast, armoring has been the dominant approach for nearly a cen- tury, primarily concrete seawalls and rock revetments. By 2018, 14% of the entire 1760 km (1100 mi) of California’s coast had been armored. However, along the more populated and developed Southern California shoreline (San Diego, Orange, Los Angeles, and Ventura Counties), 38% of the combined four-county shoreline of 373 km (233 mi) had been armored with some type of engineering structure by 2018 (Griggs and Patsch, 2019). Nationwide, Gittman et al. (2015) determined that 14% of all U.S. coastlines had been armored. However, times have changed and policies have evolved in many states, because the multiple impacts of coastal protec- tion structures have been recognized and documented. These impacts include visual effects, reduction of sand supply to the shoreline provided by formerly eroding bluffs or dunes, placement losses or beach area lost by coverage with rock revetments or seawalls, and passive erosion or gradual loss of beach because of sea-level rising against a fixed backshore (Griggs, 2005)…
Two extensive databases summarize U.S. beach nourish- ment projects, one developed and maintained by WCU (2024) and the second by the American Shore and Beach Preserva- tion Association (ASBPA, 2024). These are searchable by state and include individual locations, dates, volumes, and purposes. Considerable effort has been extended to collect these data and develop the records, although there are some significant gaps in the records because of incomplete recording by the Army Corps of Engineers, which carries out most of these projects.
However, the data presented in these two databases rarely agree completely. For example, the WCU site reports 2482 indi- vidual nourishment episodes, whereas the ASBPA site reports 3633 episodes. WCU lists a total volume of 1,200,068,128 million m3 (1,579,037,010 yd3), whereas ASBPA lists 1,276,389,376 m3 (1,679,459,705 yd3). Although ASBPA lists a known total cost of $8.8 billion, WCU lists a total cost of $10.3 billion but a 2022 adjusted cost of $15.7 billion…
Florida has been the largest recipient of federal beach nourishment funding, with 27.4% of the national projects, 22.2% of the total sand volume, and 25% of the adjusted costs. Palm Beach County alone, as one example, has benefited from 84 nourishment projects from a mixture of offshore dredging and Lake Worth inlet maintenance. It is not clear from the WCU database where the sediment from Lake Worth inlet dredging goes; presumably, it is onto local beaches. The inlet has been dredged 18 times, with 5.7 mil- lion m3 (7.5 million yd3) removed at a cost of $46 million. Between the first dredging in 1944 and 1985, there is no funding source or justification listed (WCU, 2024). In 1987– 98, the federal government is listed as the funding source and the justification is navigation…
Beach nourishment clearly has important benefits. Widely cited examples are the three projects in 1978, 1979, and 1980 that delivered approximately 5,069,000 m3 (6,670,000 yd3) of sand to Miami’s beaches at a cost of $119 million (WCU, 2024), which brought back the visitors and hence the econ-omy. White coral sand was pumped from deposits a few miles offshore, and Miami Beach was widened by approximately 60m (200 ft along the nearly 6 km (10-mile-long barrier island shoreline. This beach nourishment project has often been cited as the most successful beach restoration in the United States because of its longevity and positive economic impact (Houston, 2013)…
Although a case has been made that beach nourishment is a sustainable strategy for mitigating the effects of ongoing and accelerating sea-level rise, the study that produced this conclusion has been criticized for being too limited in scope and for omitting many key considerations. Land subsidence is also a long-term process along the U.S. Atlantic coast, which along with the increasing severity and size of hurri- canes, will also shorten the life span of beach nourishment projects. Twenty-four years ago, the Heinz Center (2000) con- cluded that of the 10 Atlantic and Gulf coast counties analyzed, only 1 county could justify the cost of beach nourishment based on expected erosion damage over the next 60 years.
After a century of beach nourishment with increasing expenditures and volumes of sand being pumped from off- shore onto beaches, as well as a clearer understand of the challenges posed by an accelerating rate of sea-level rise, shoreline subsidence, and short-term extreme events such as nor’easters and hurricanes, it is time to face reality. We cannot continue to nourish our way out of sea-level rise and recurring storm damage at increasing public expense but instead need to seriously plan now for a longer-term future for the shoreline and the inevitable necessity of moving inland.


