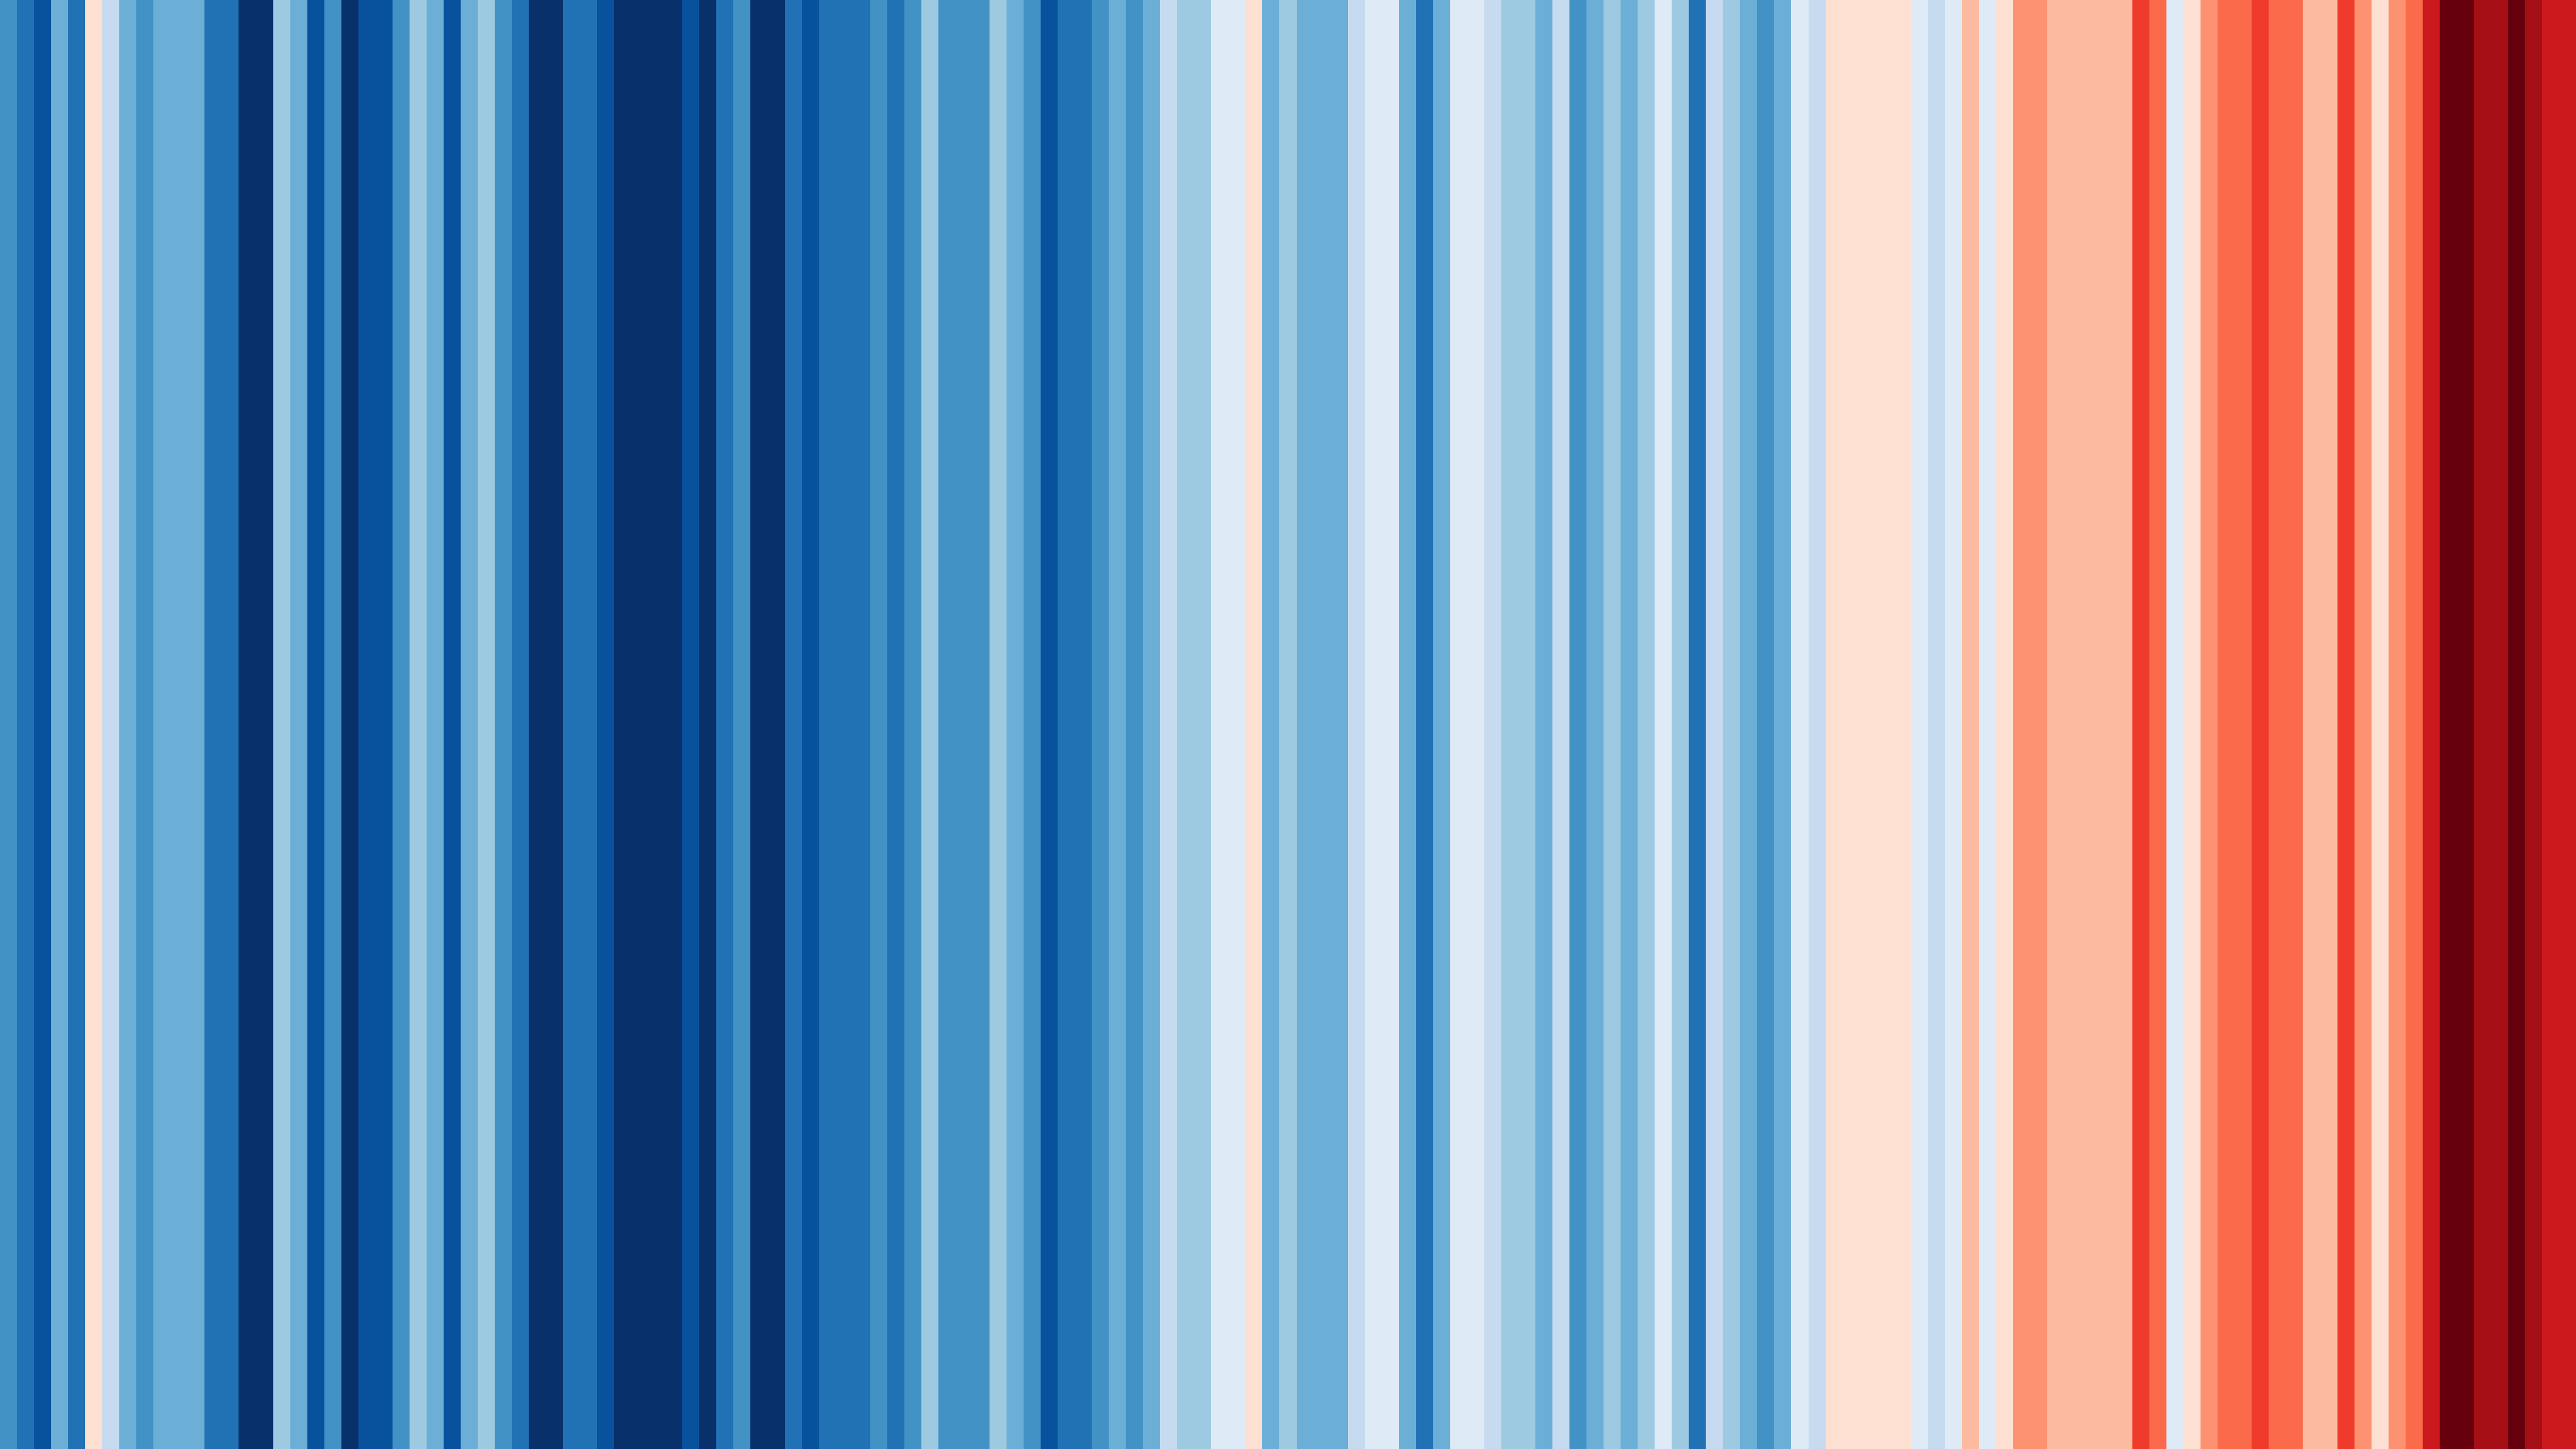
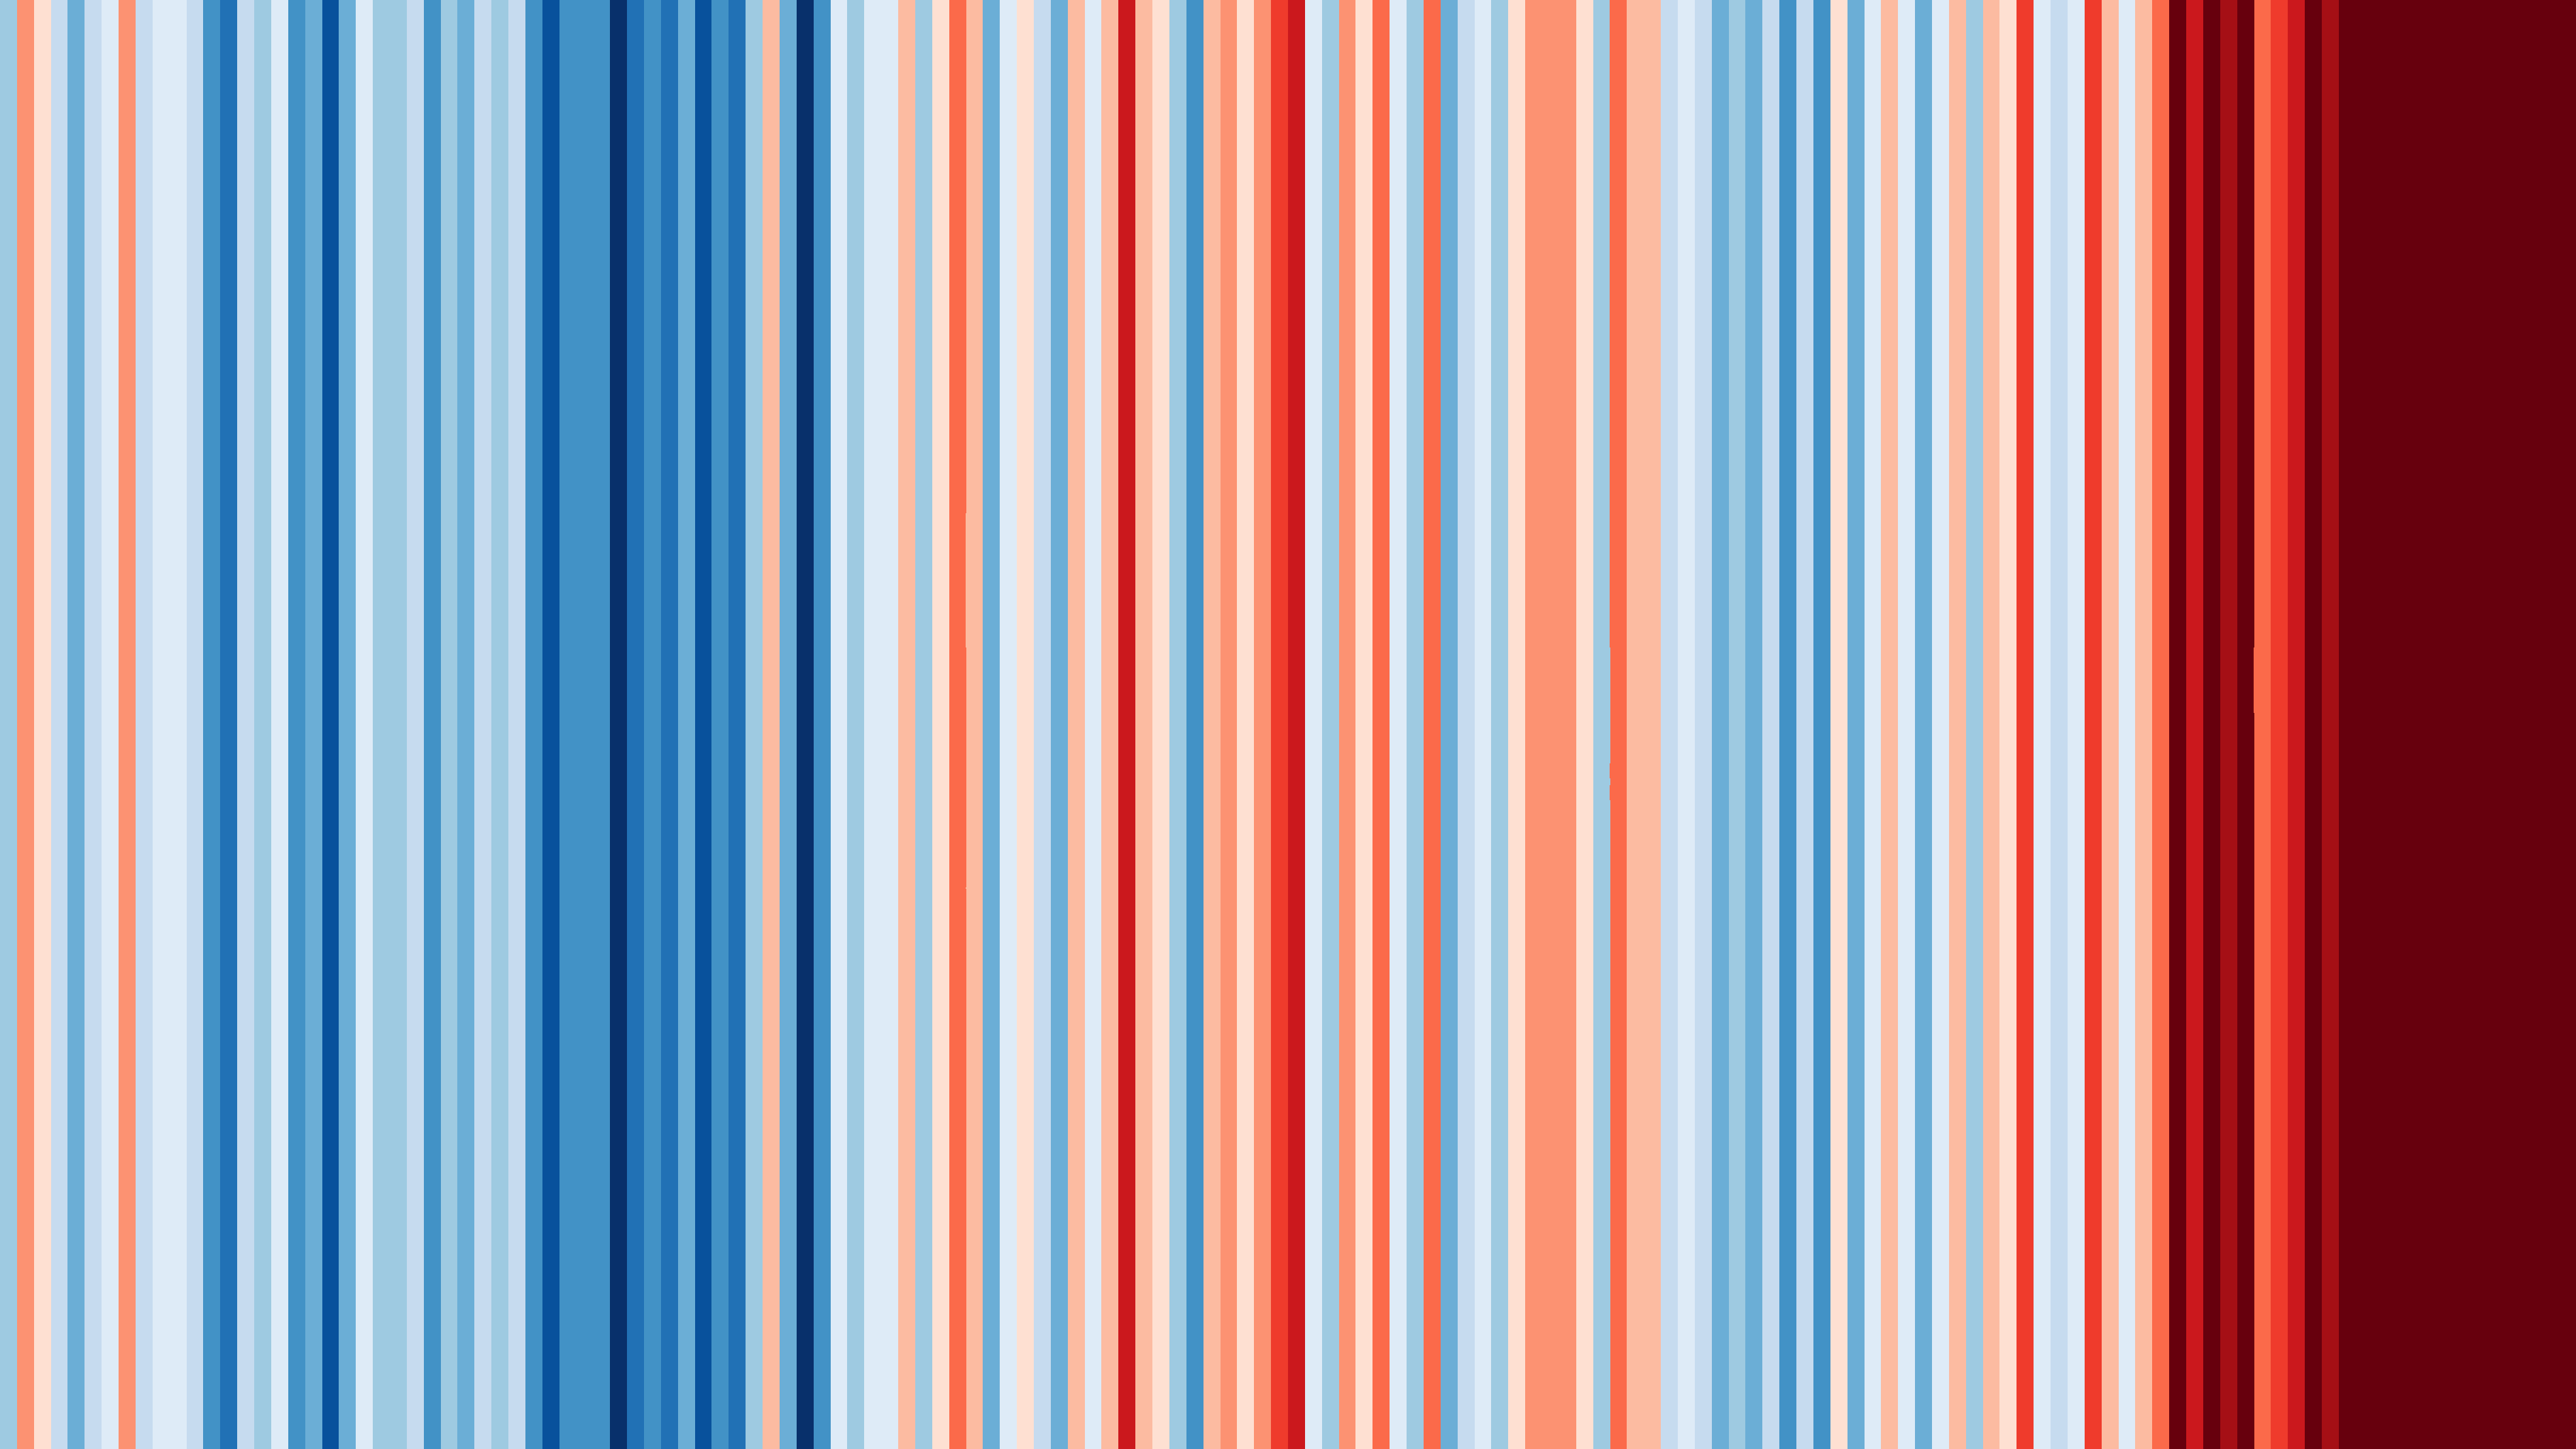
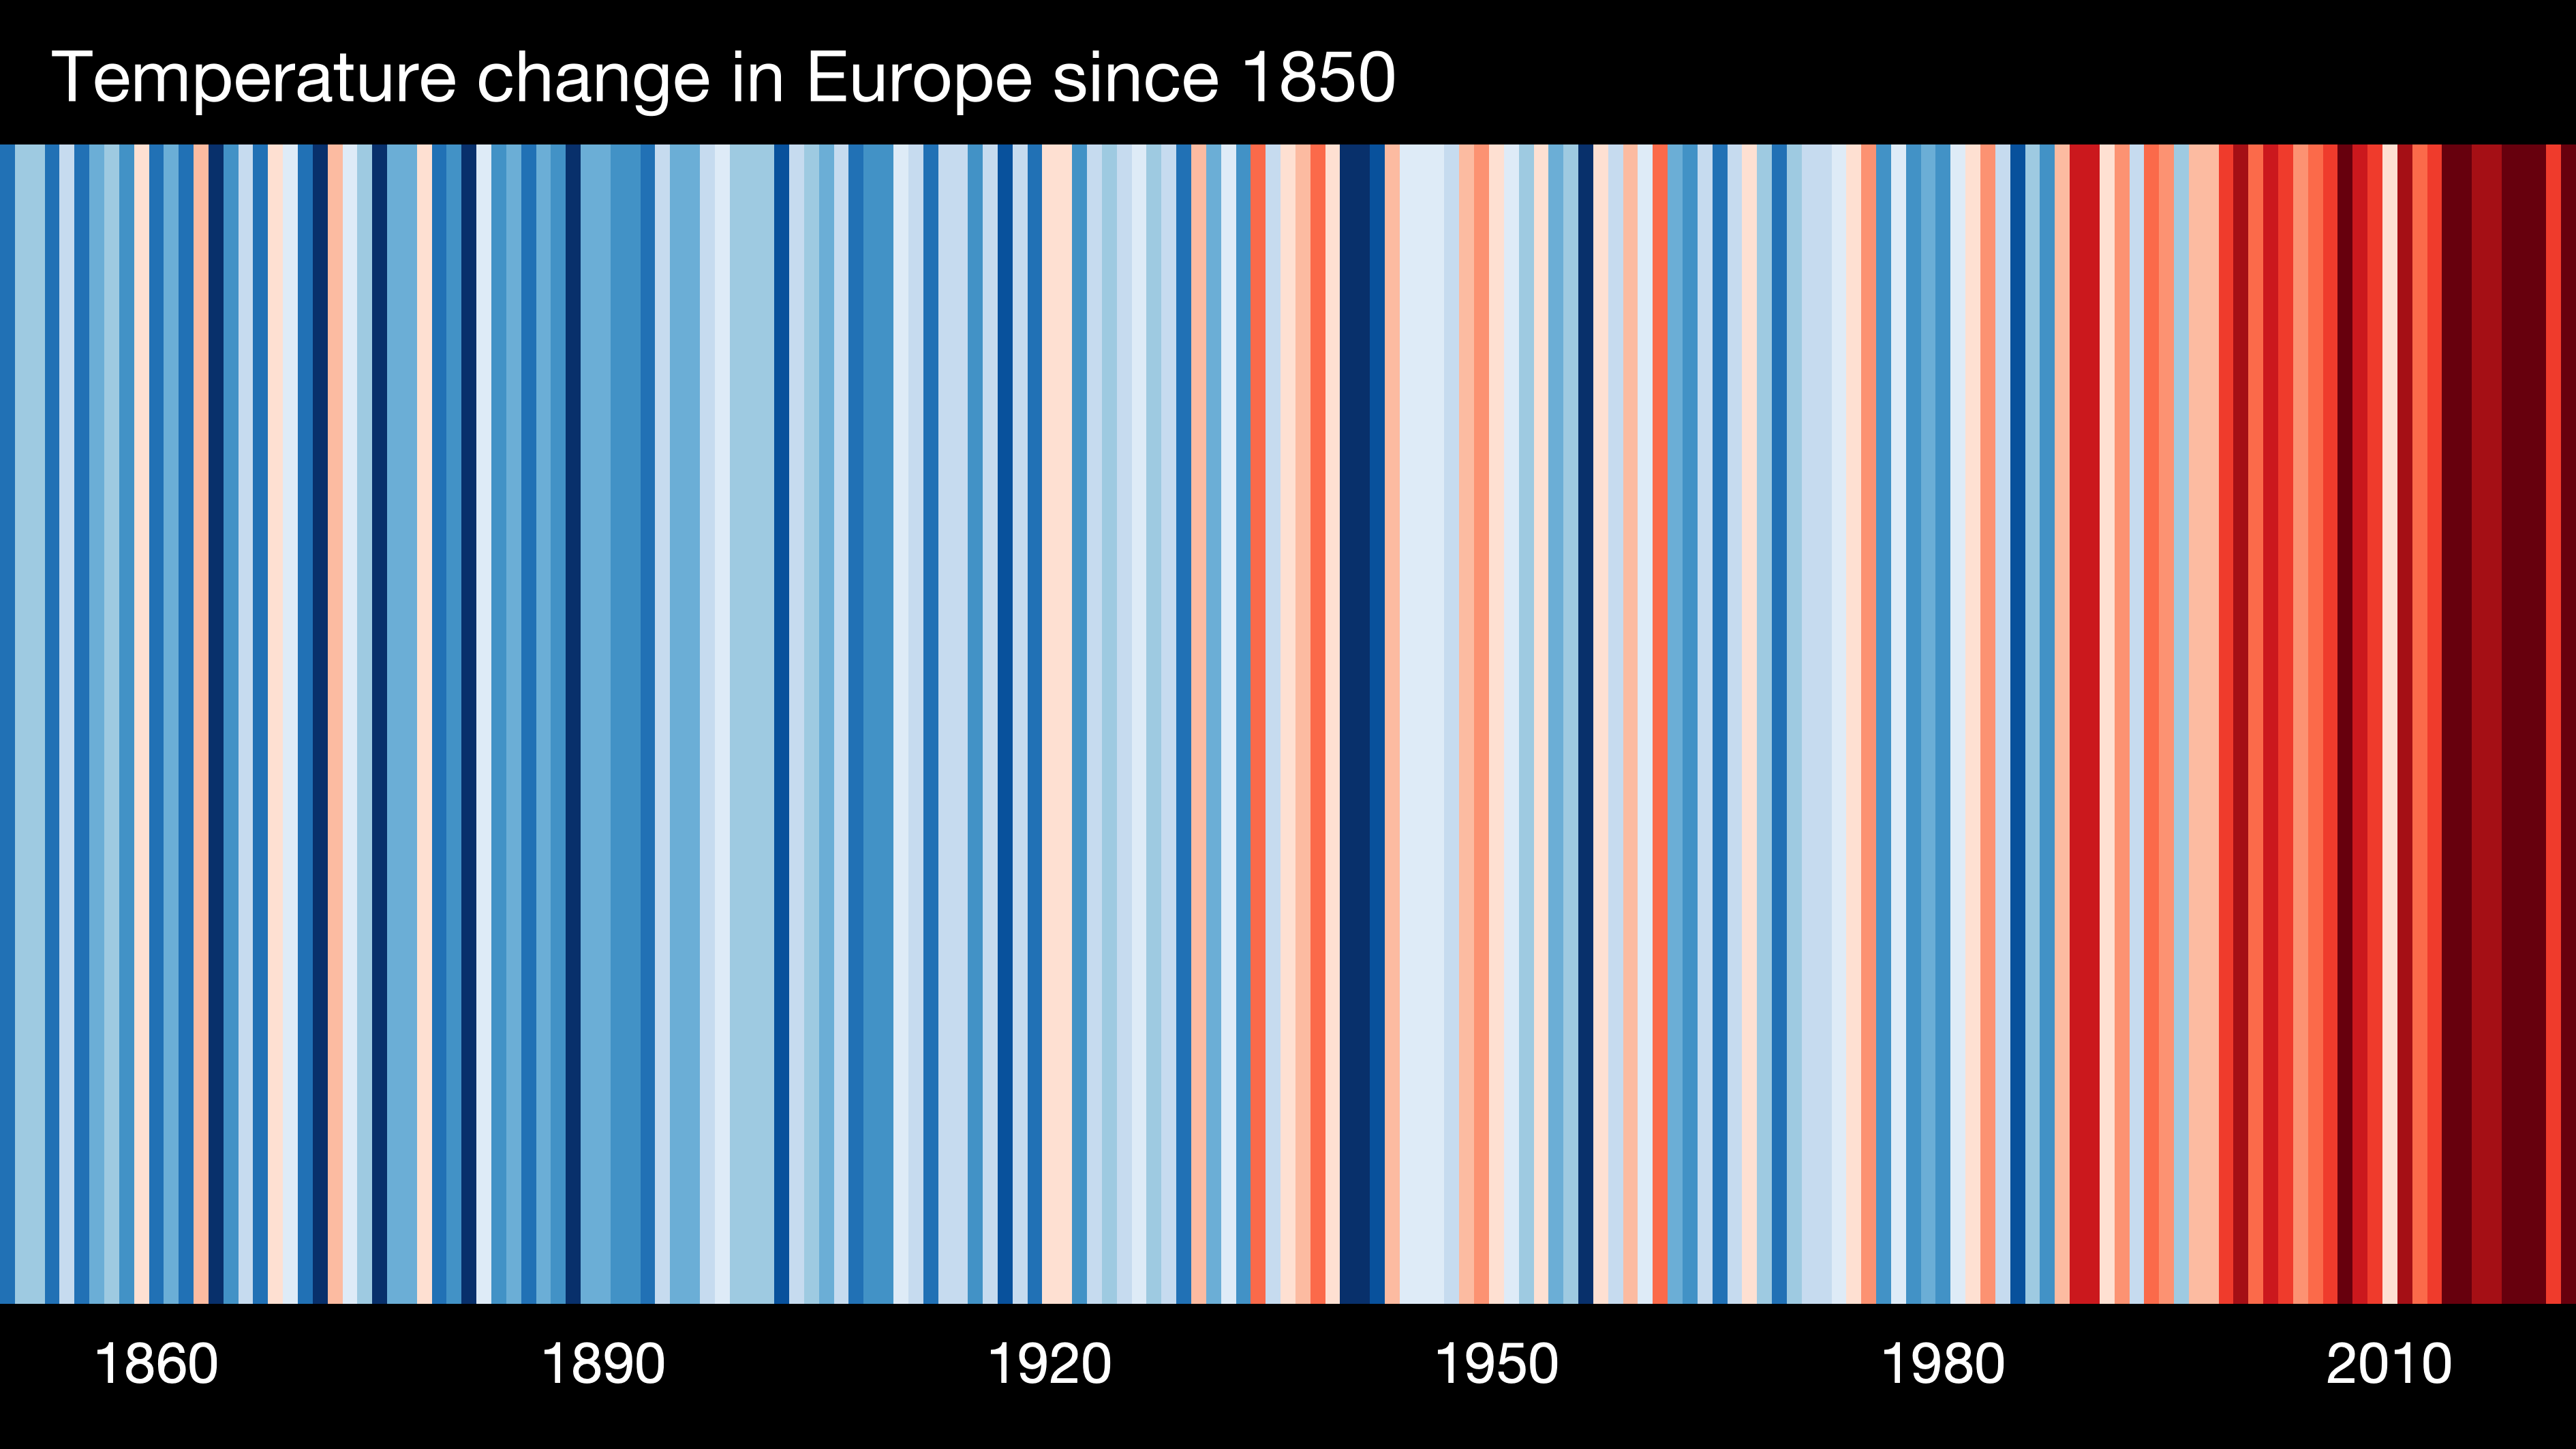
Warming Stripes: A representation of annual global temperatures from 1850 - 2022. Using color alone in a minimalist style climate scientist Ed Hawkins was able to intuitively convey global warming trends to the general public. The graphic has inspired many diverse applications around the world and is a powerful reminder of our climate crisis. (Ed Hawkins, National Centre for Atmospheric Science, University of Reading, using Data from Berkeley Earth, NOAA, UK Met Office, MeteoSwiss, DWD, SMHI, UoR & ZAMG, CC BY 4.0 via https://showyourstripes.info/).
Why this Climate Change Data is on Flip-flops, Leggings, and Cars - VOX
A "Tempestry" Kit for Atwood, KS 1929 (by Justin Connelly, CC BY-SA 4.0 via Wikimedia).
“Warming stripes” keep showing up on clothes and crafts…
Climate scientists don’t usually become tastemakers.
But Ed Hawkins at the National Centre for Atmospheric Science at the University of Reading in the United Kingdom has a knack for creating haunting viral visuals of humanity’s impact on the planet. And a pattern he created last year is now showing up on everything from flip-flops to blown glass to Teslas.
Hawkins noticed that the past five years have been the hottest on record, as average global temperatures keep peaking in a more than century-long pattern of gradual, and then rapid, warming.
And he wanted to convey to the public in a fresh way just how dramatic this recent warming is — warming that is undoubtedly tied to greenhouse gas emissions from human activity…
The Surprising Story of ‘Warming Stripes’ - the New York Times
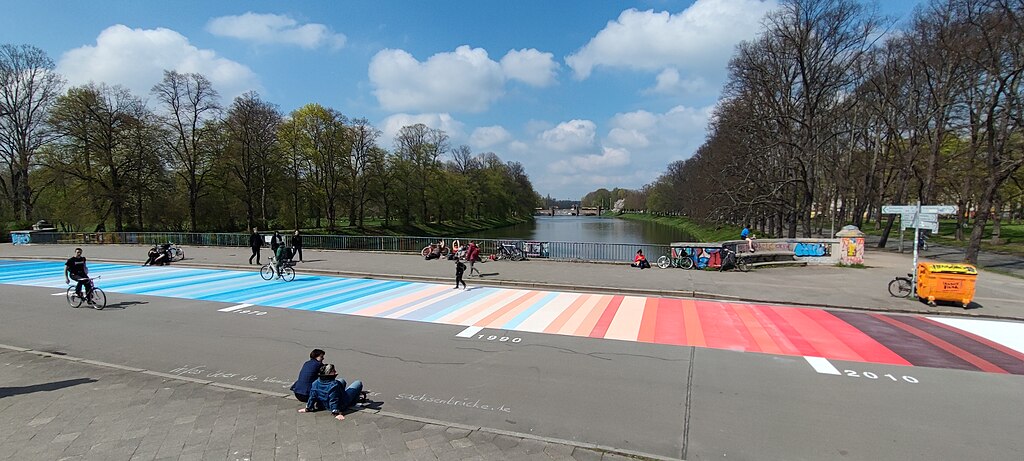
Warming Stripes on the Sachsenbrücke Leipzig (by Steffenster, CC BY-SA 4.0 via Wikimedia).
One of the most popular ways to visualize rising temperatures is a simple graphic known as warming stripes. Here’s the backstory…
You’ll find warming stripes on face masks (see my Twitter profile), on scarves … on buildings (the Scottish power company beamed them onto the stack of a coal-fired power plant that was about to be scrapped), a bridge in Leipzig, Germany, a rock band album cover.
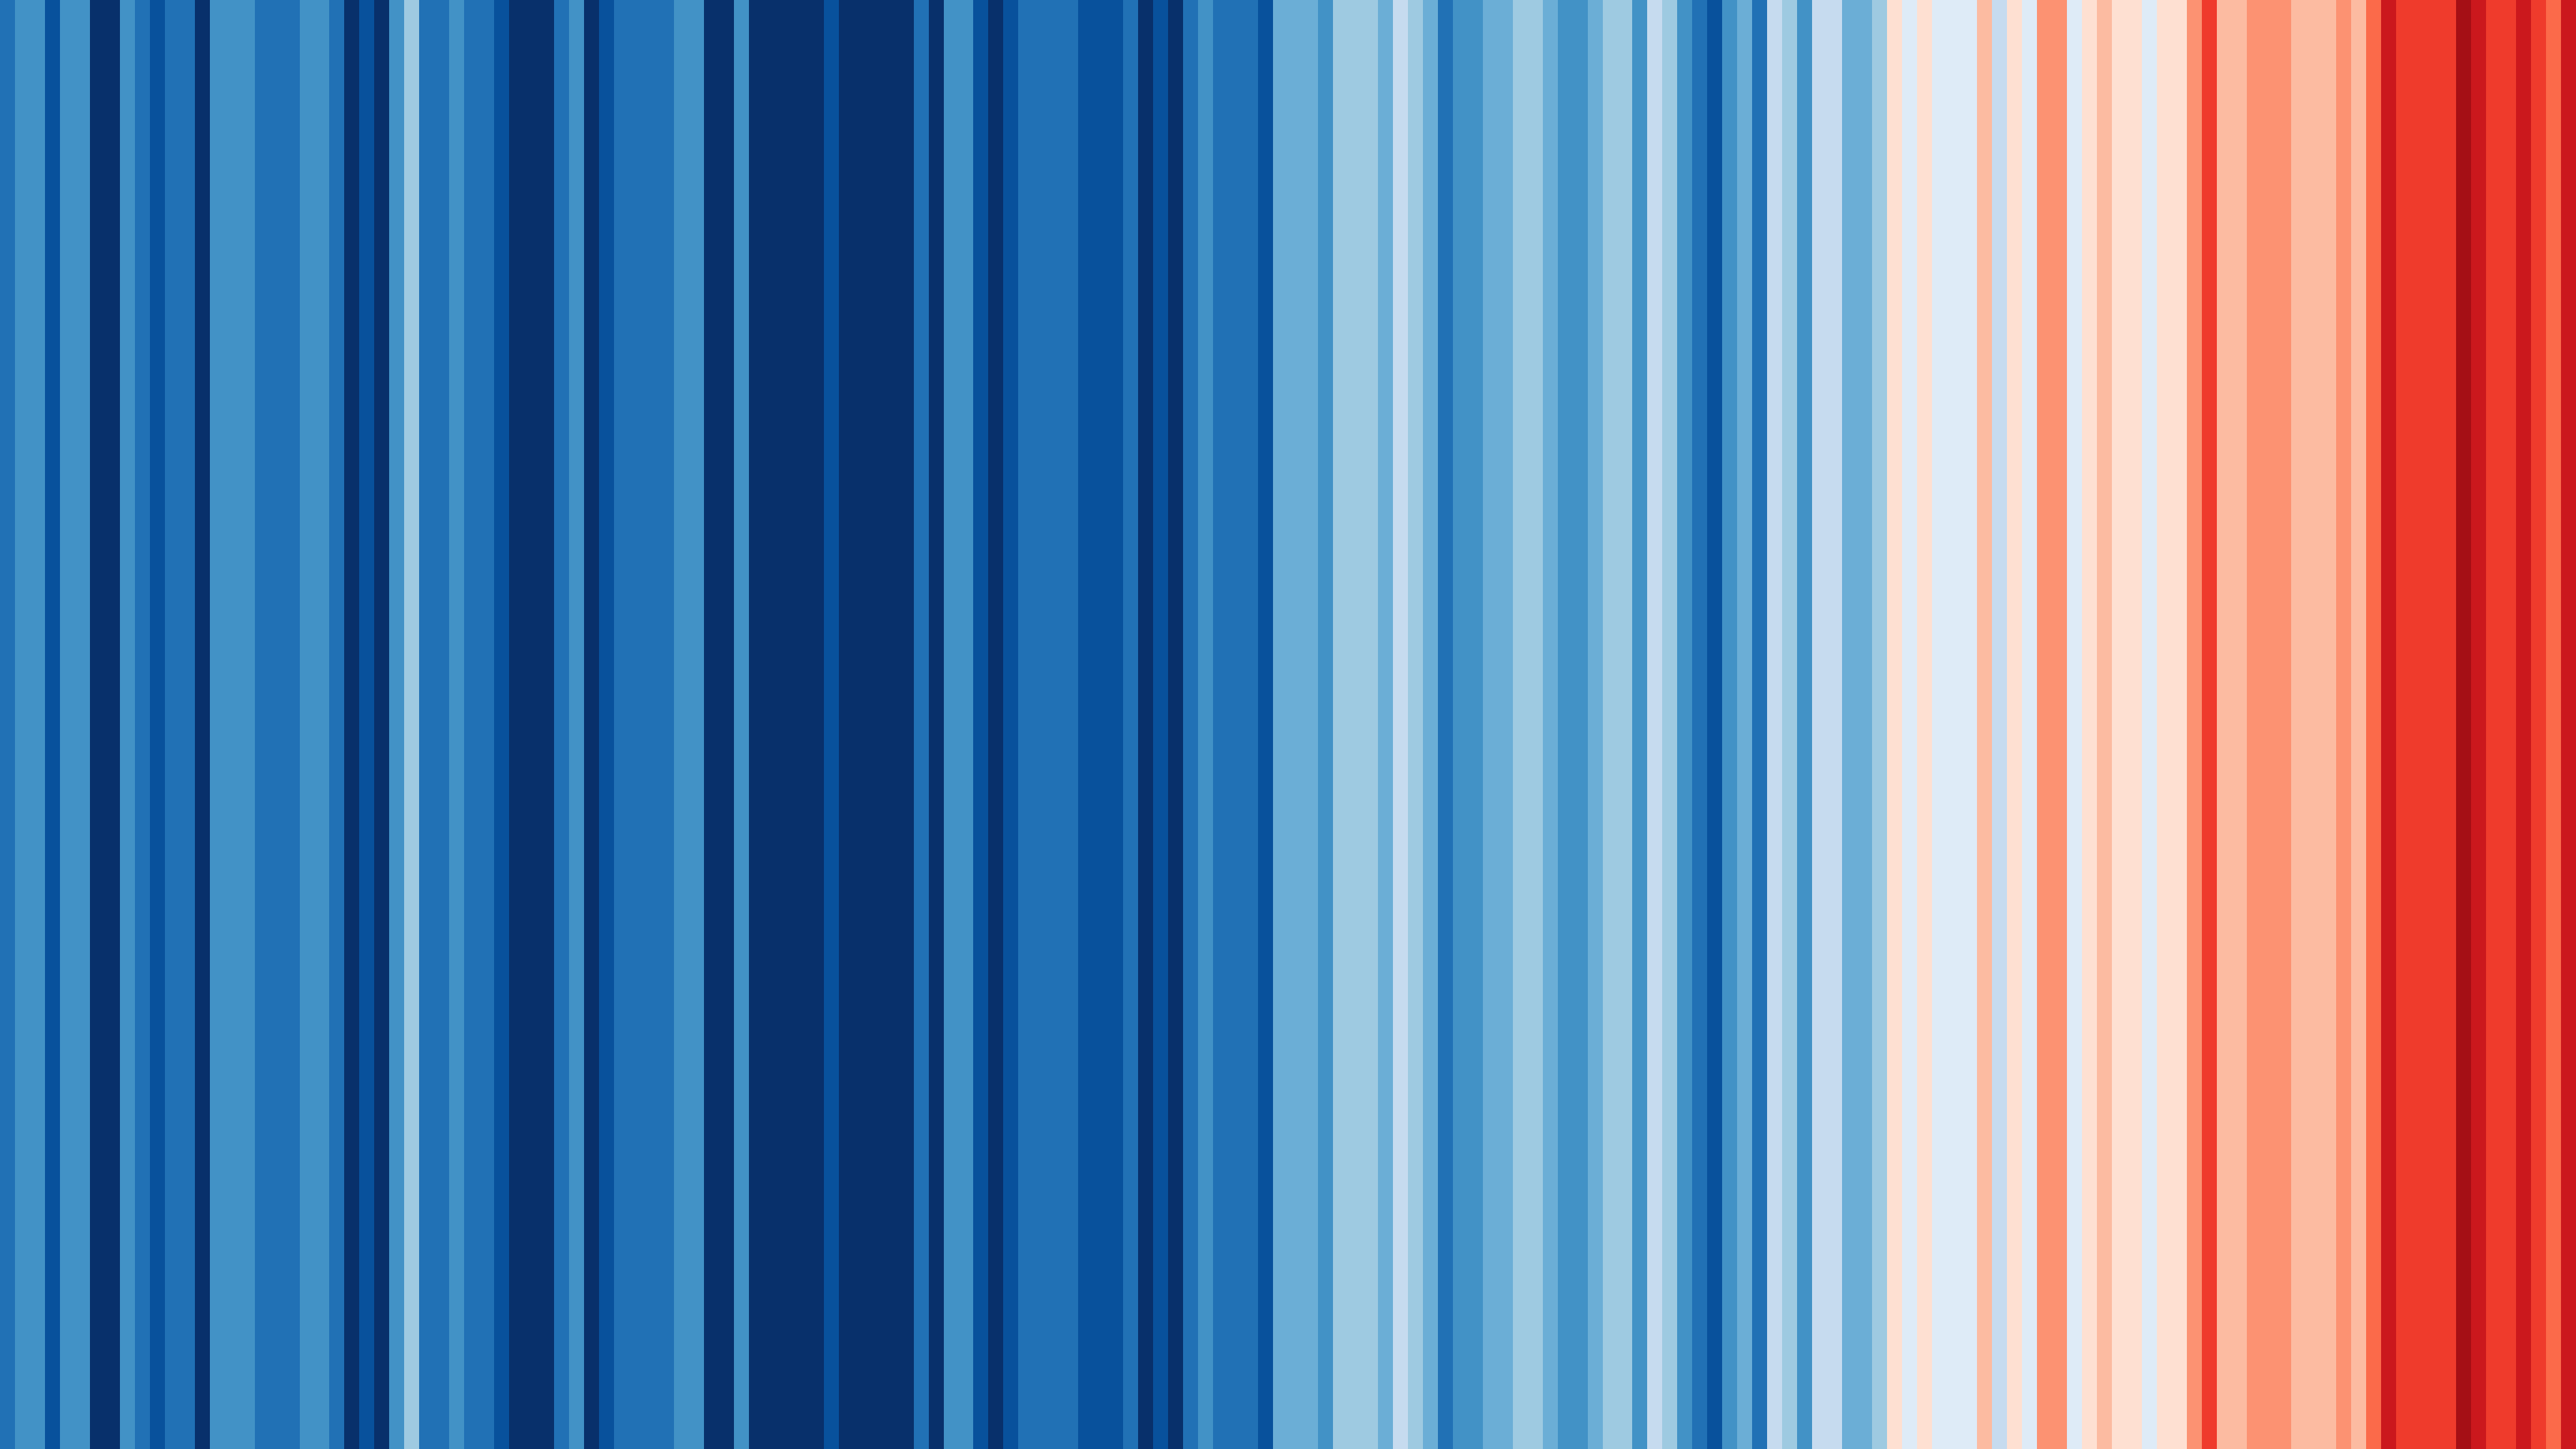
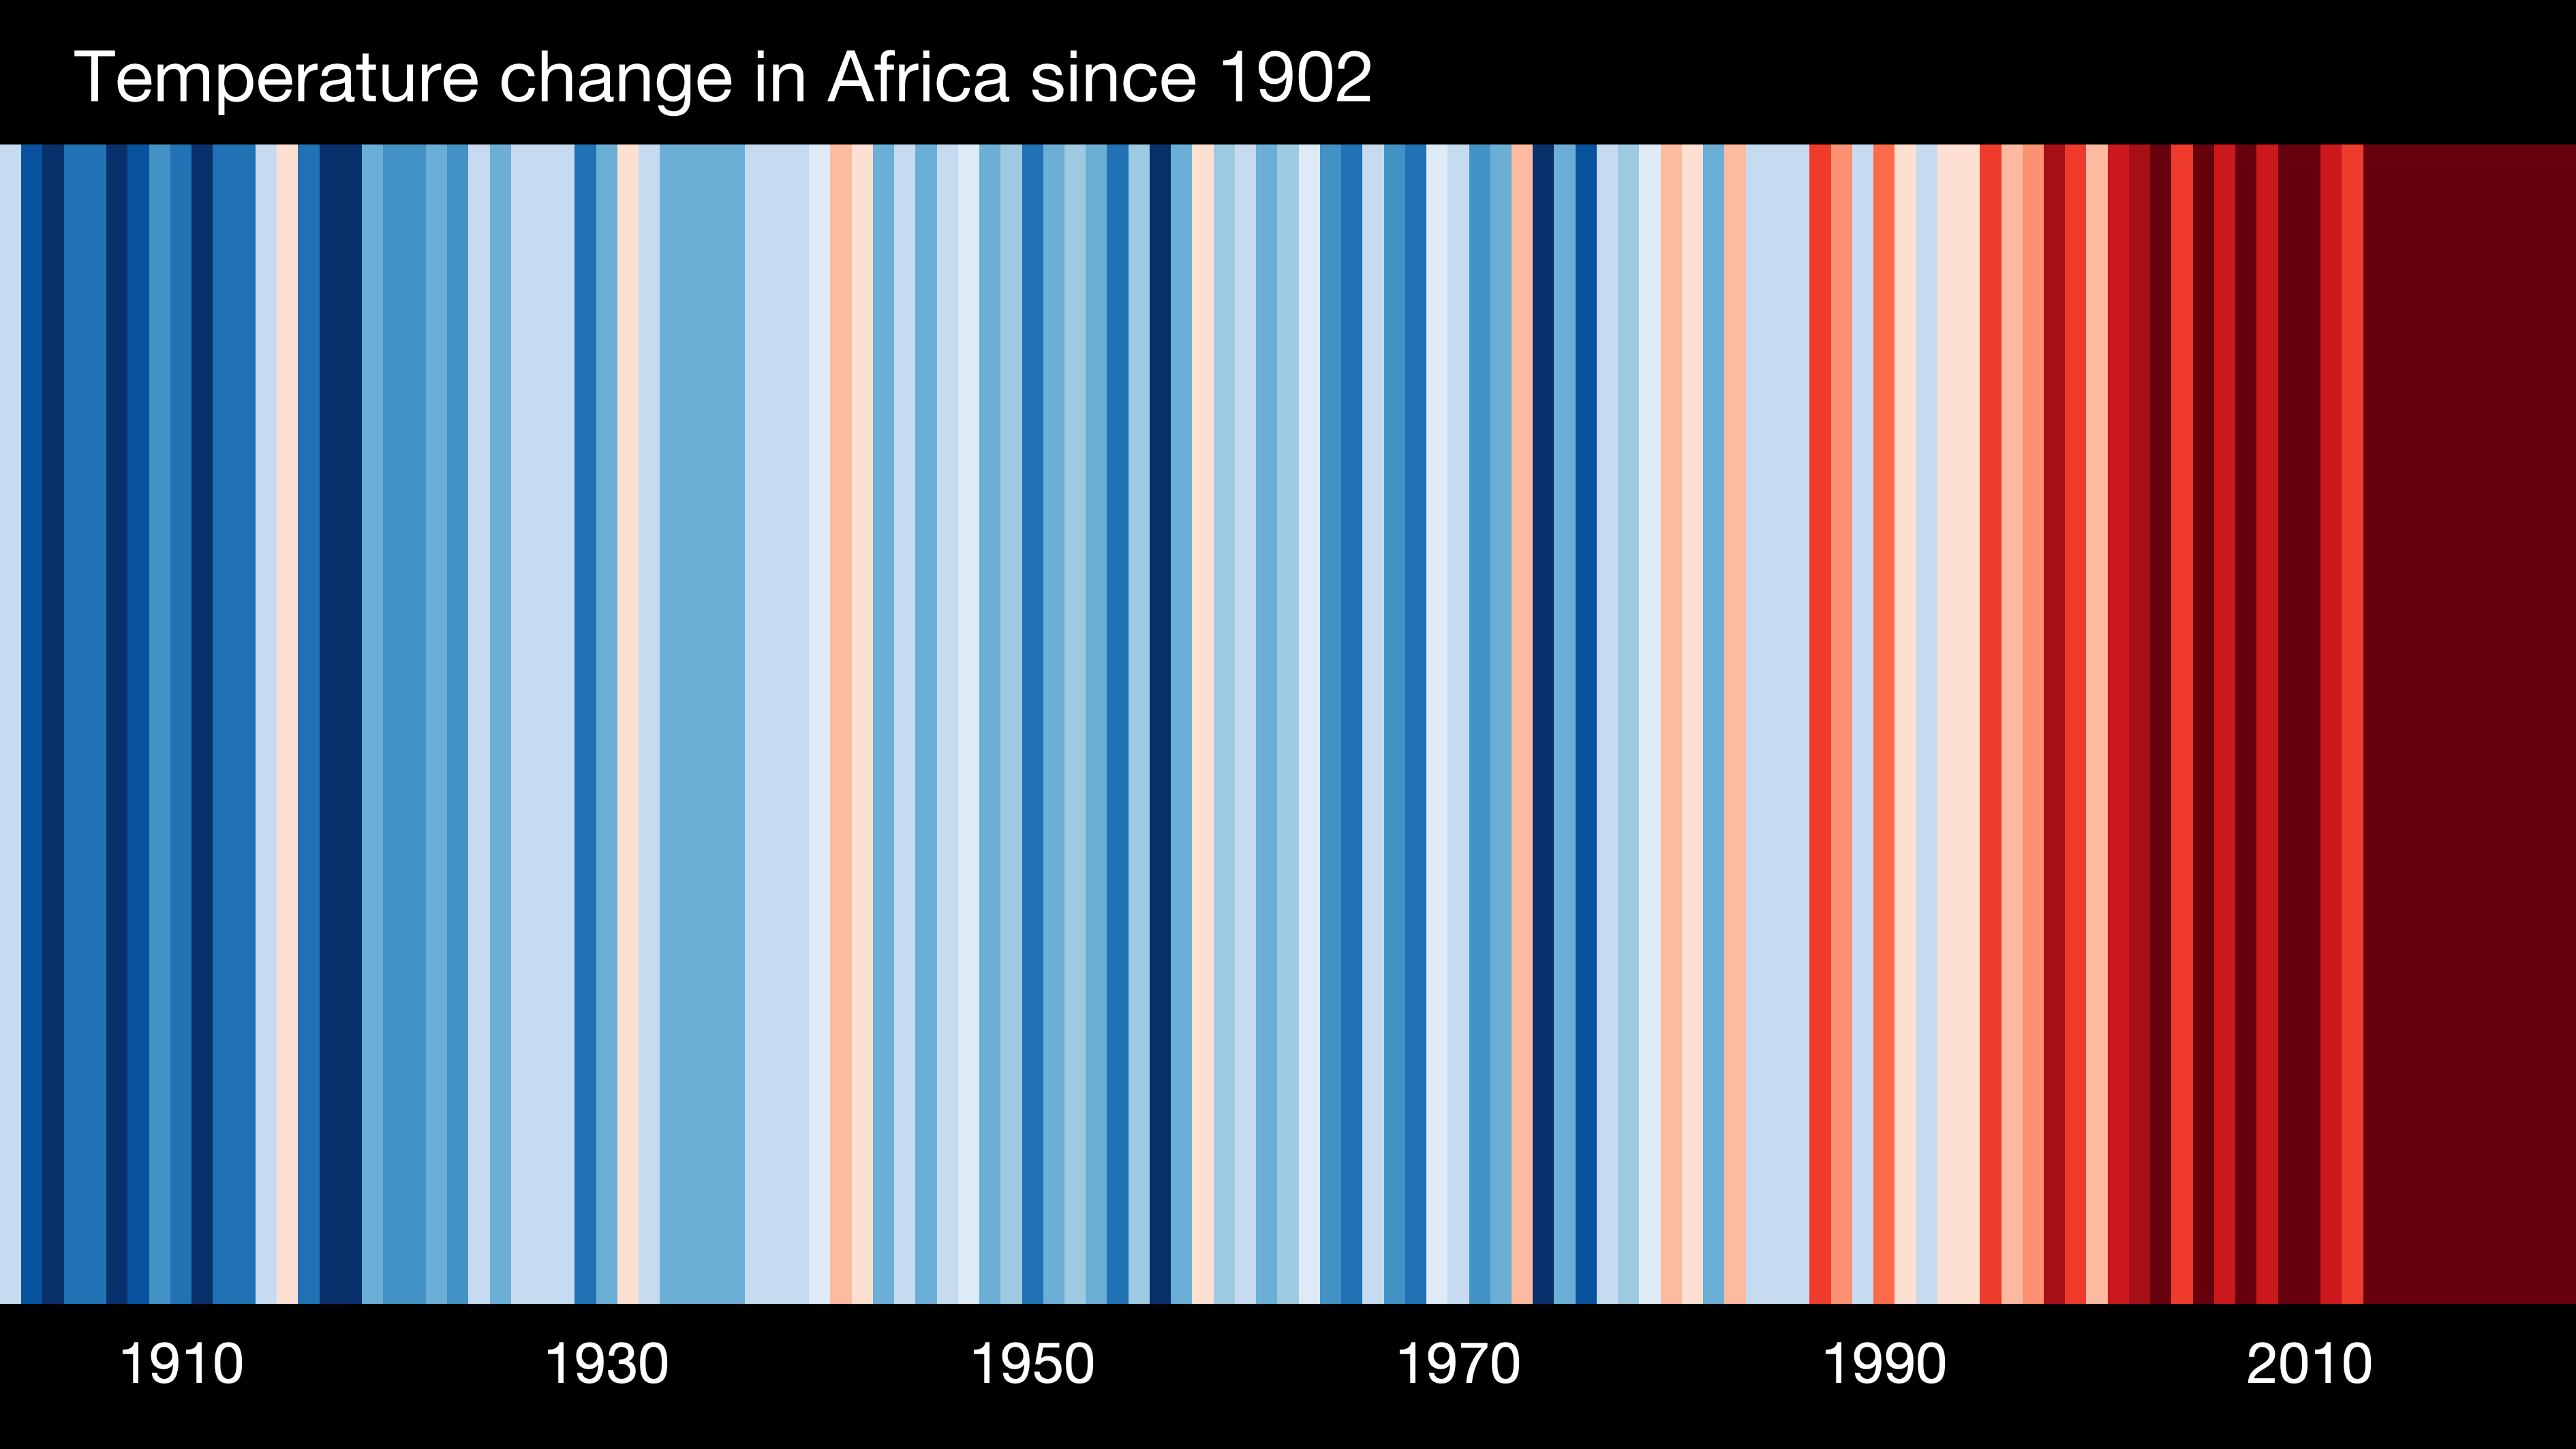
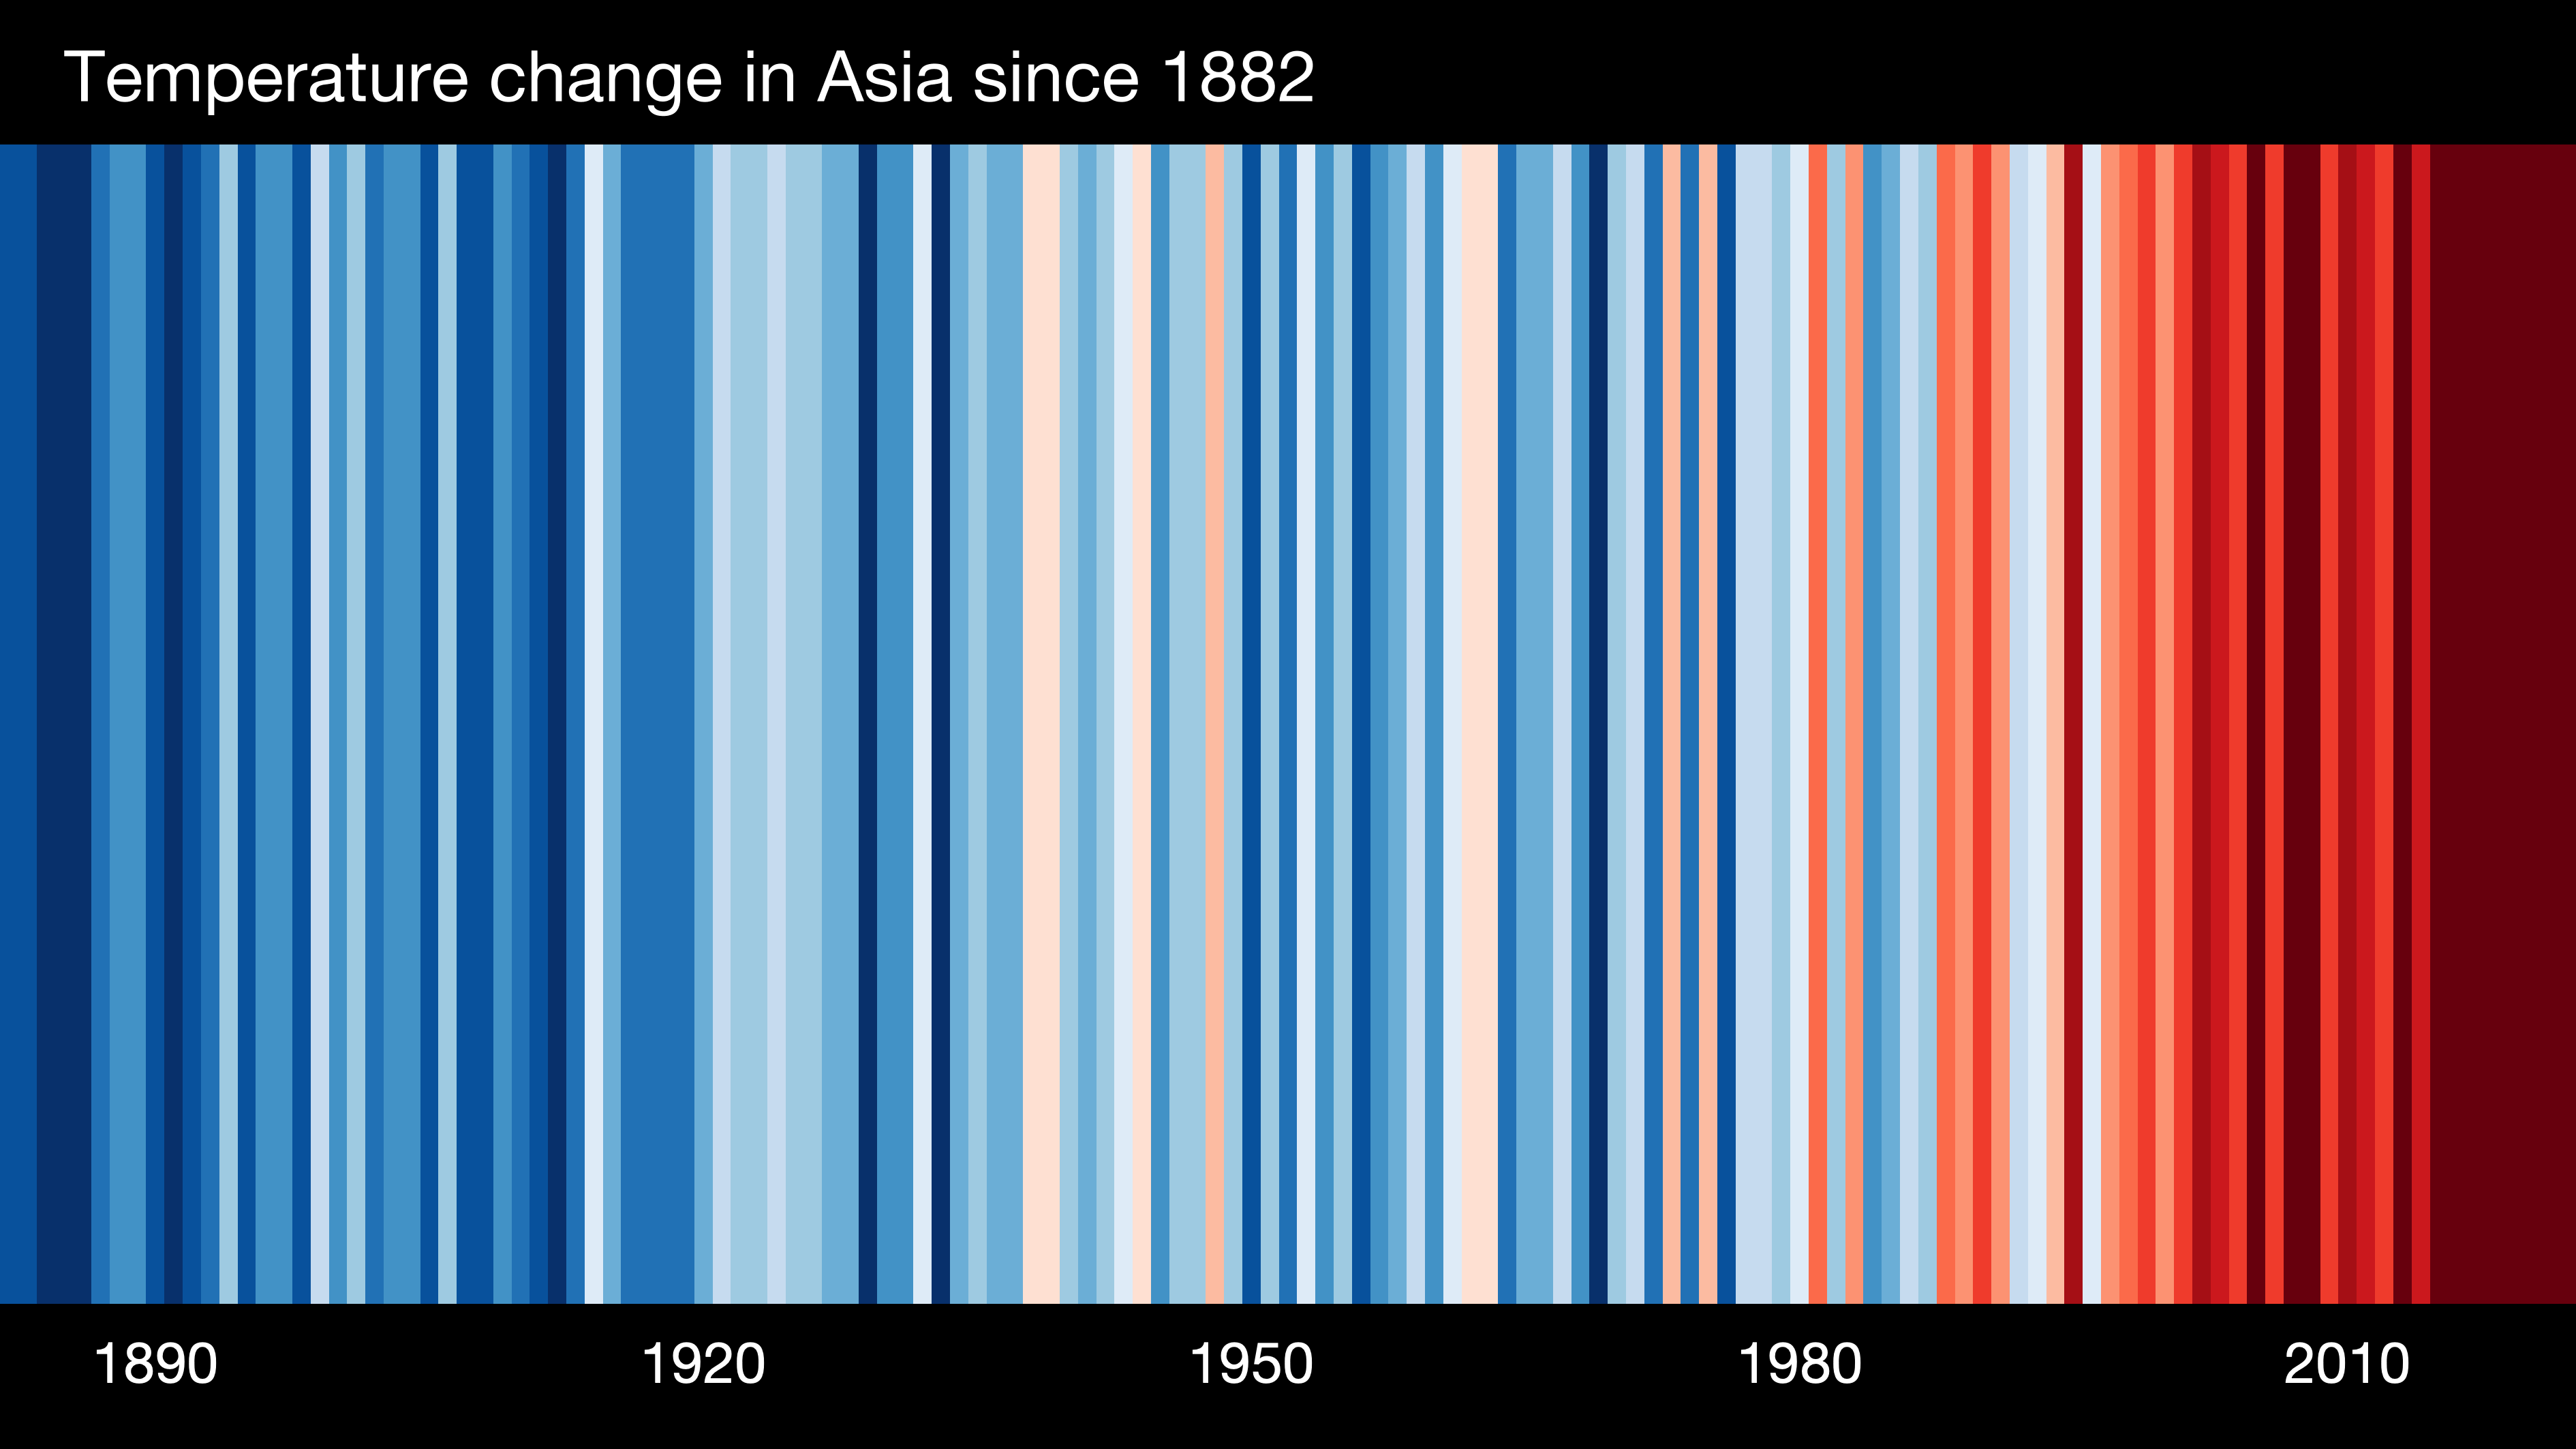
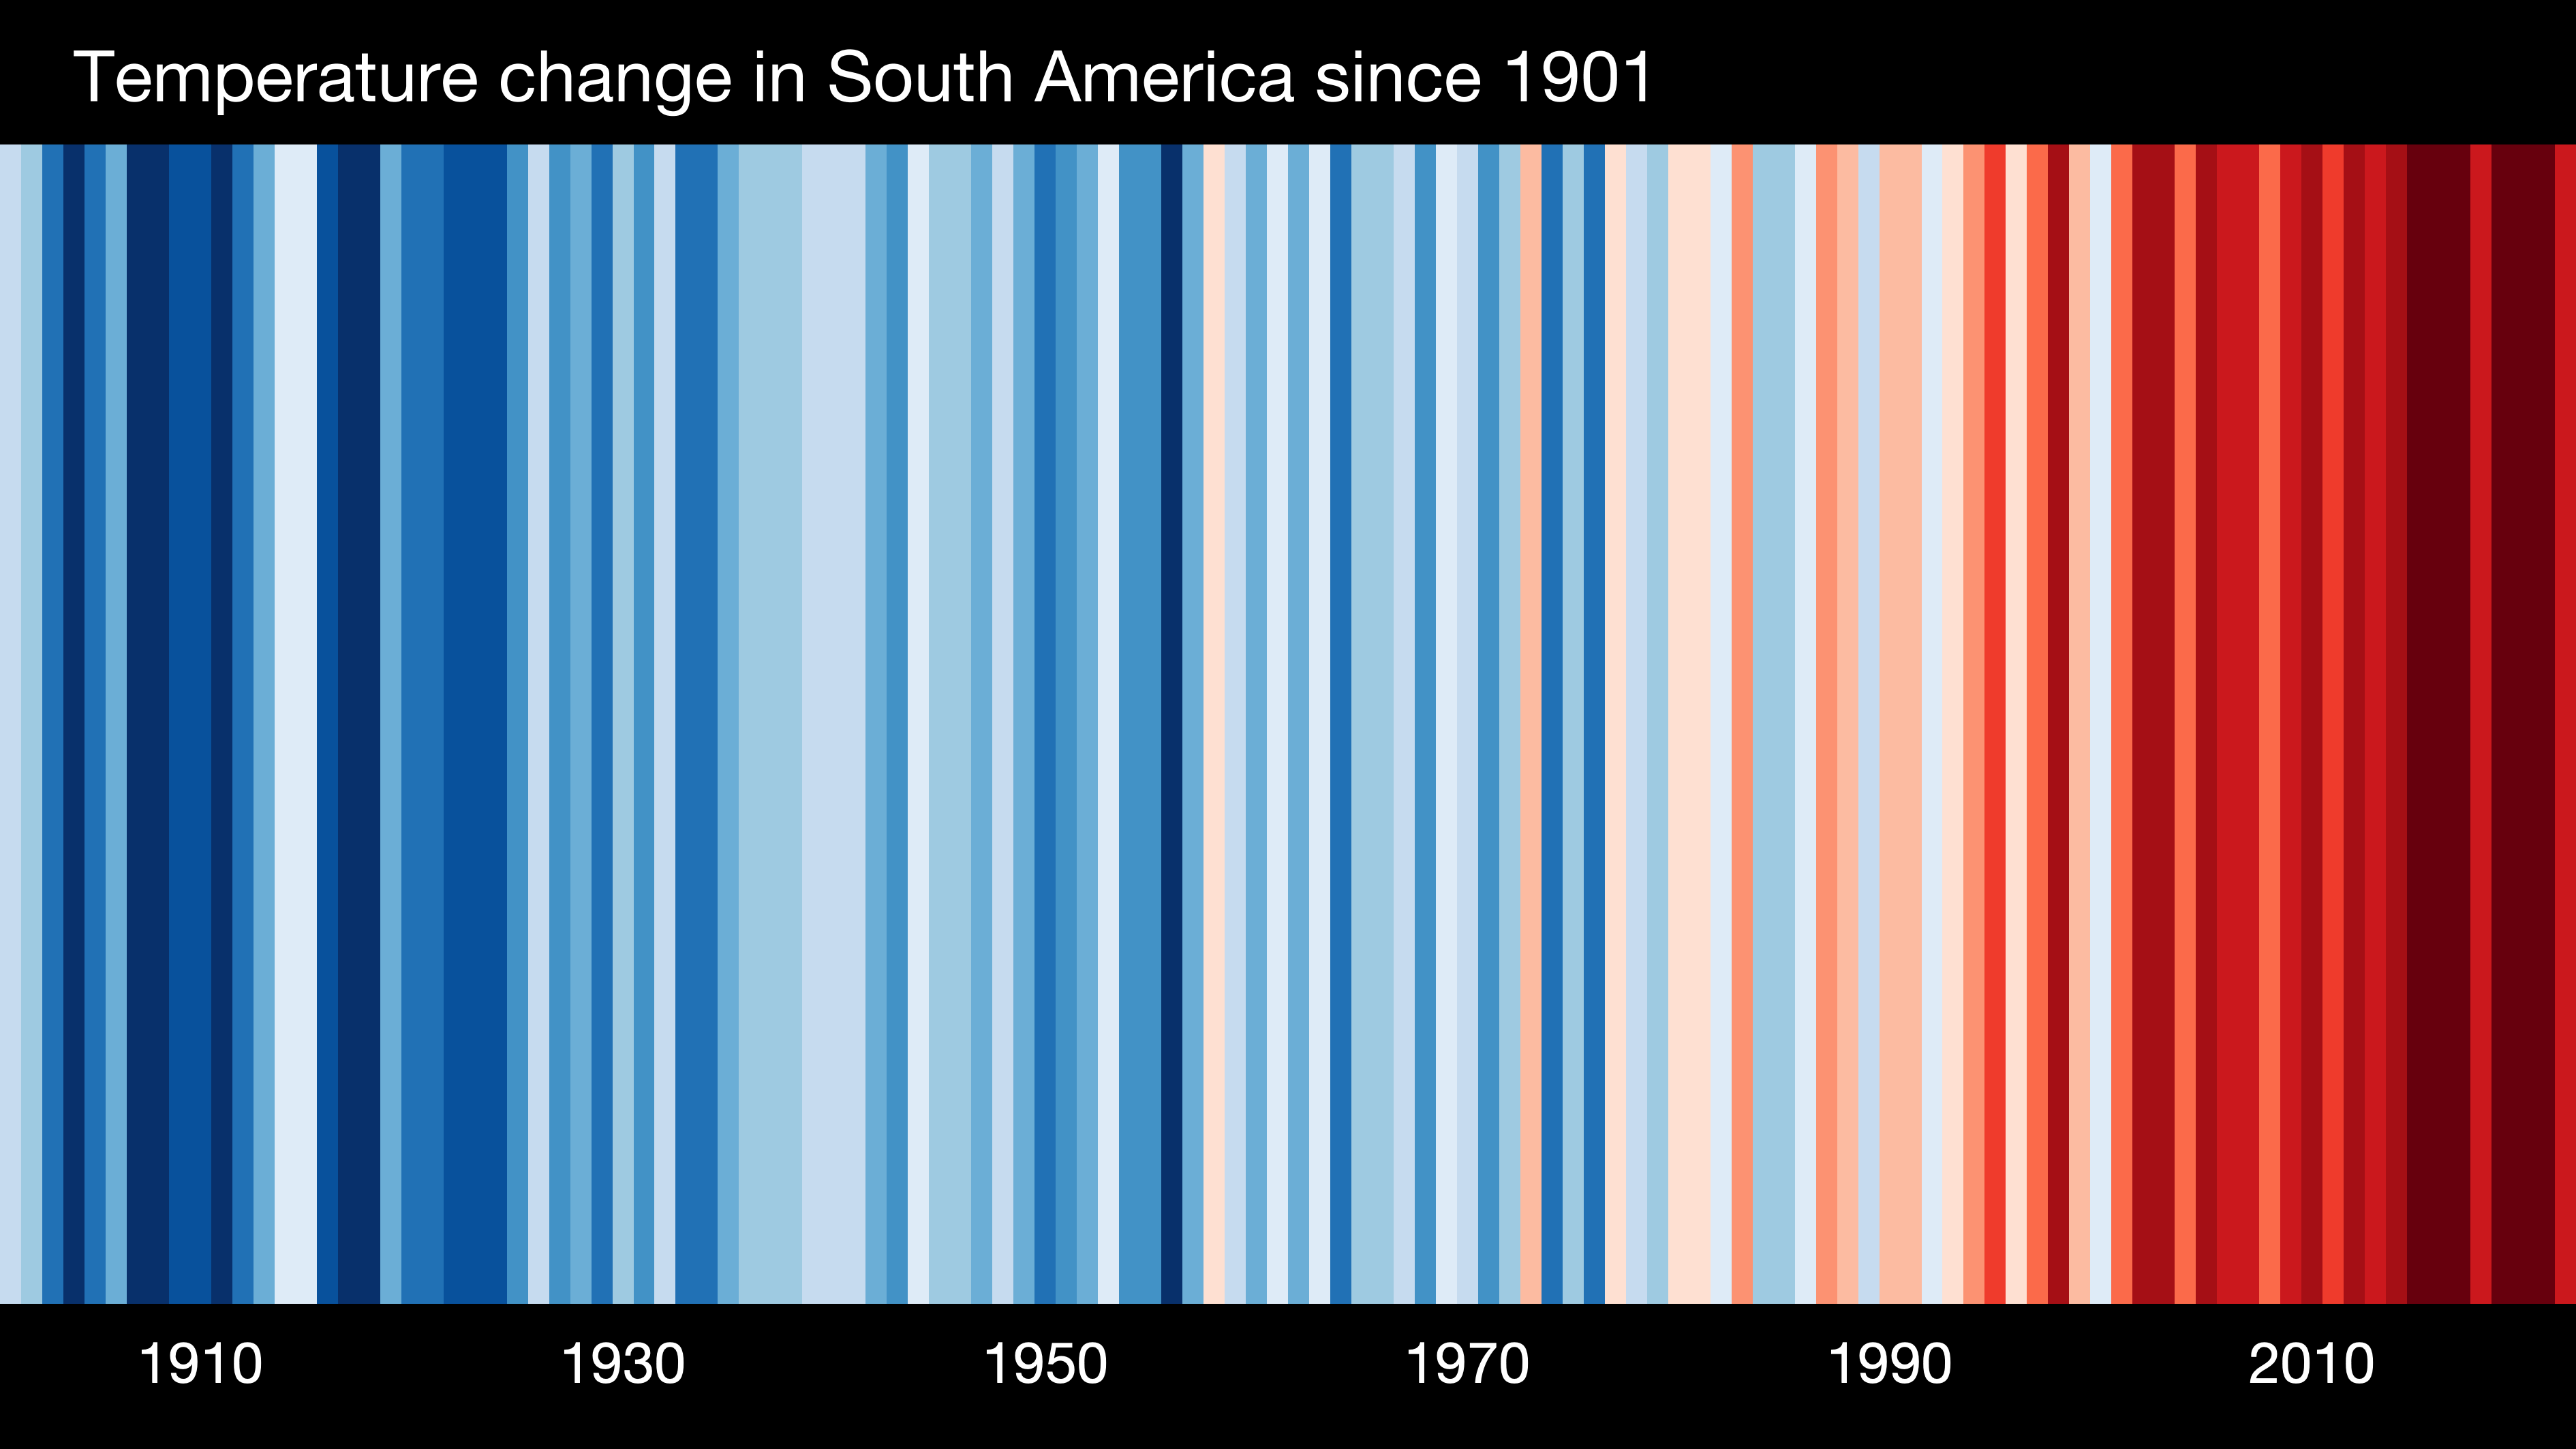
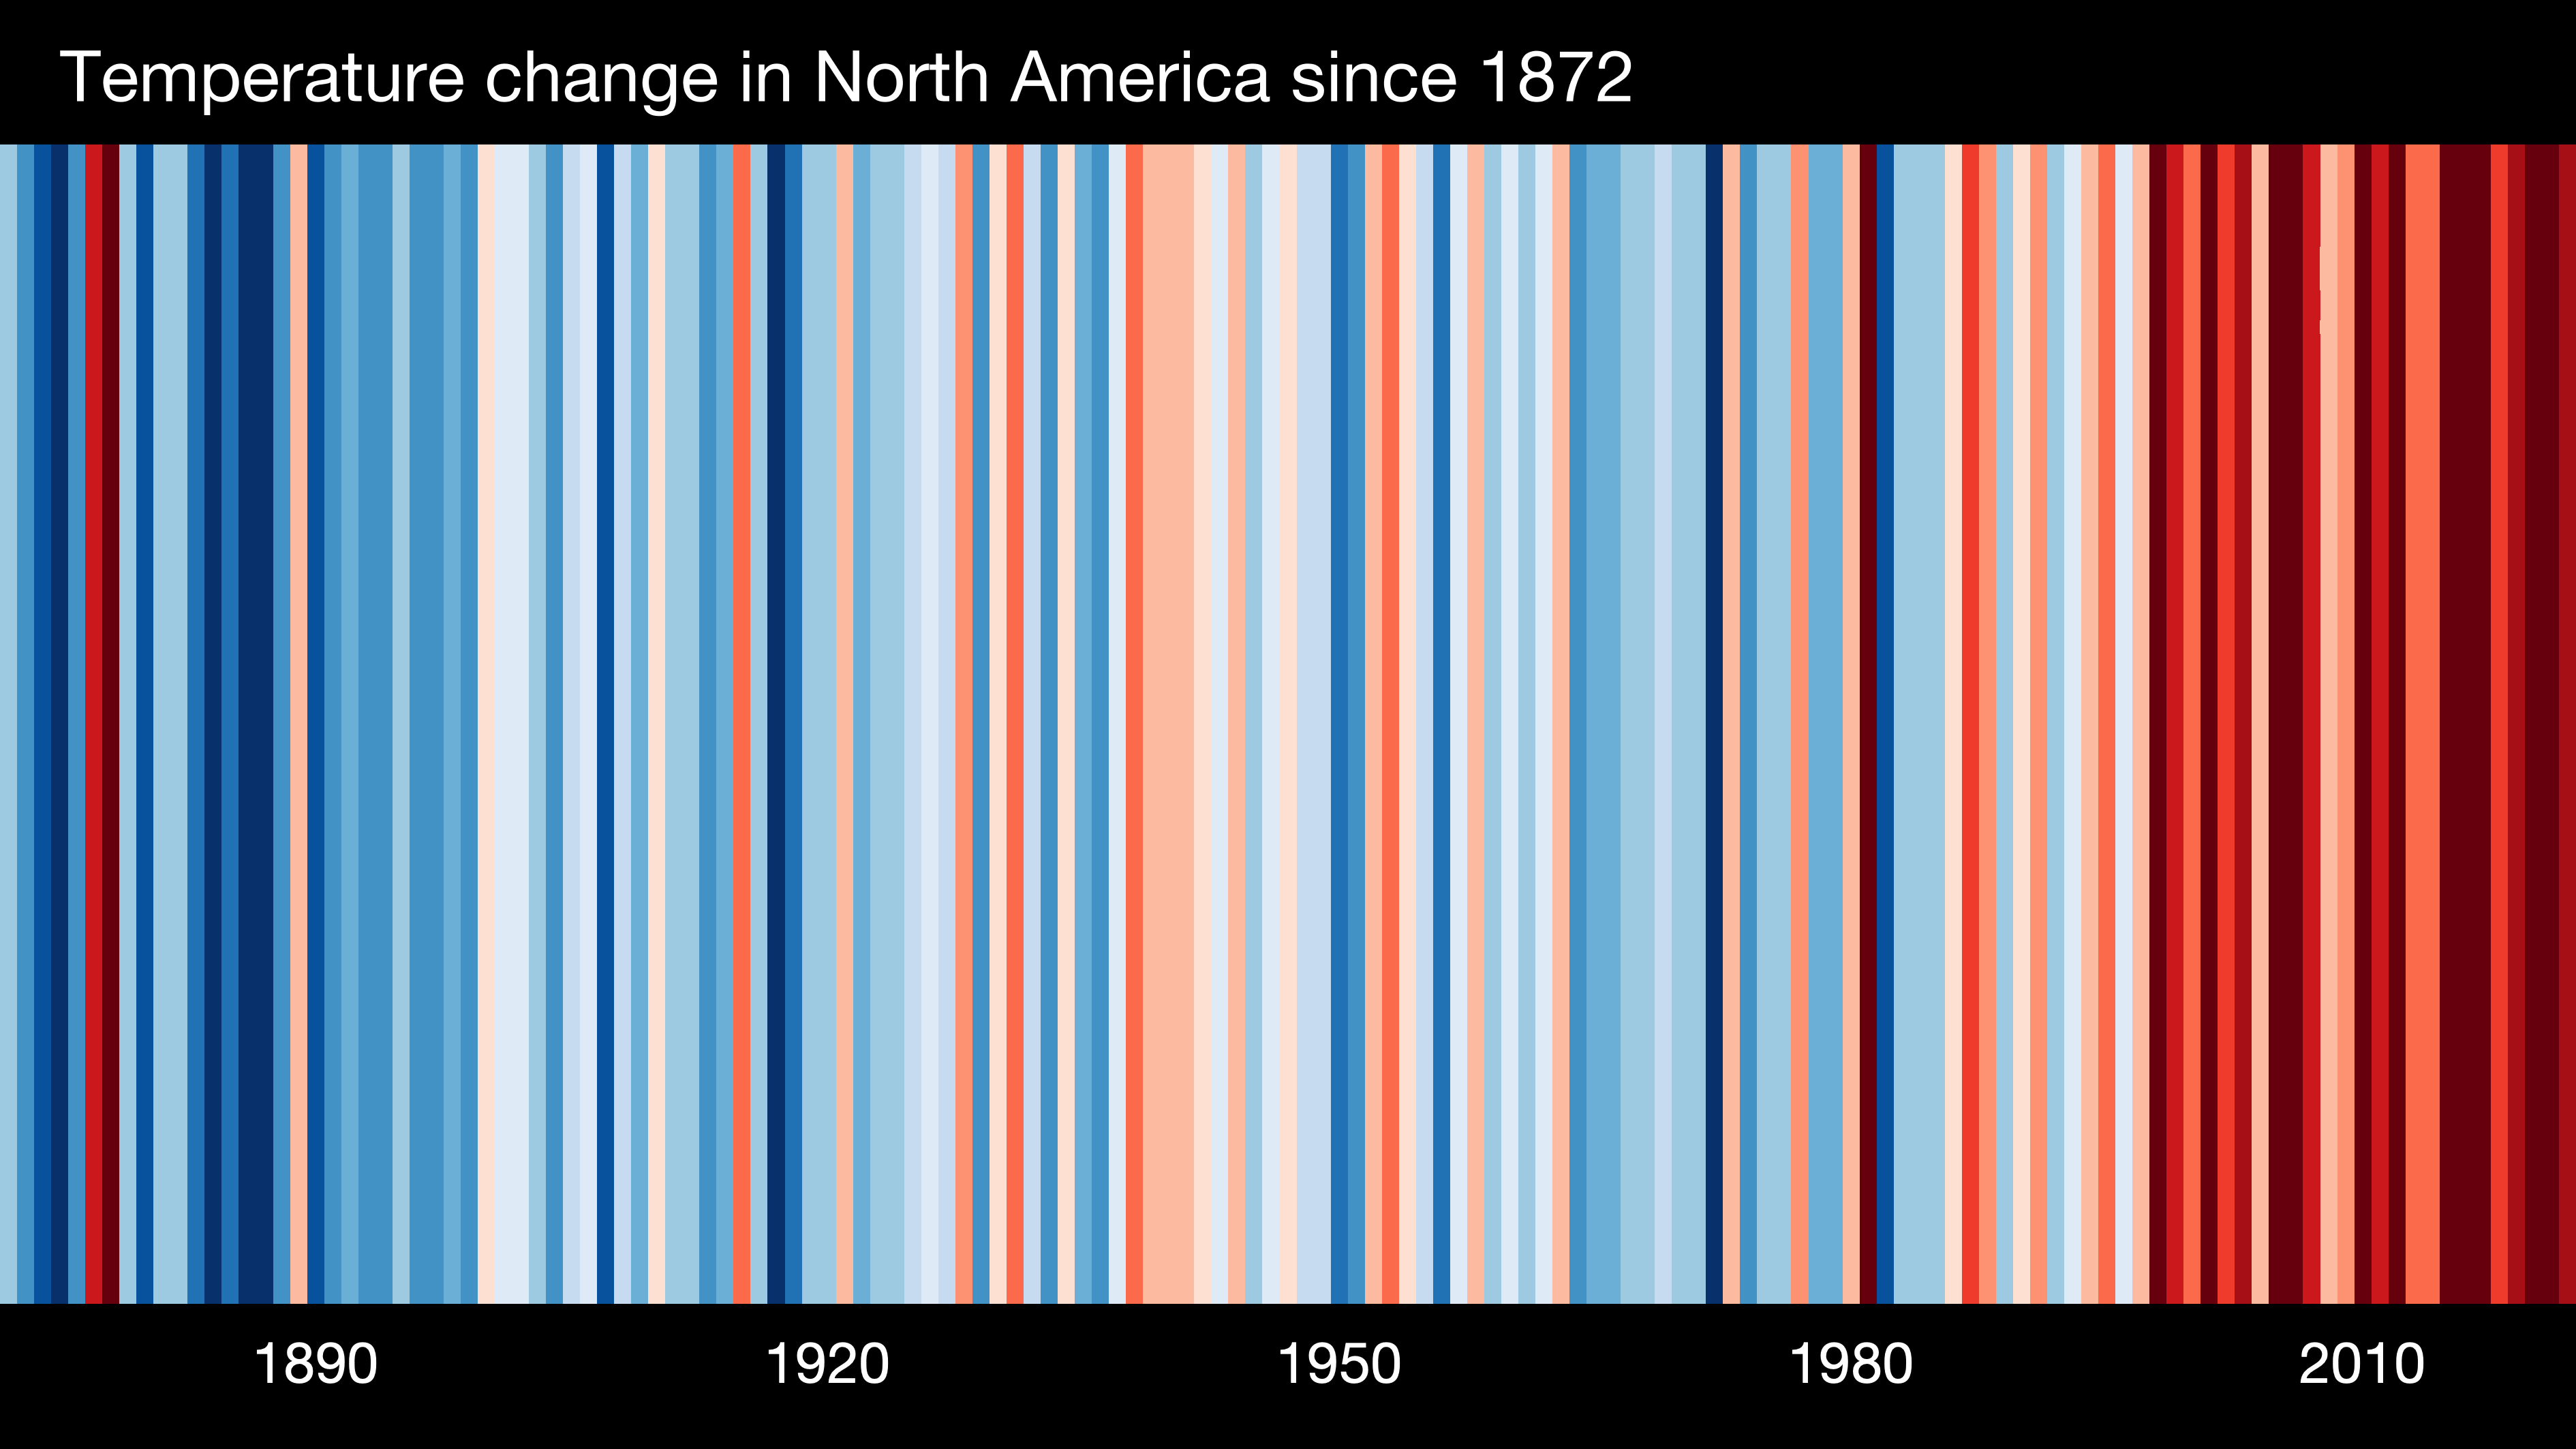
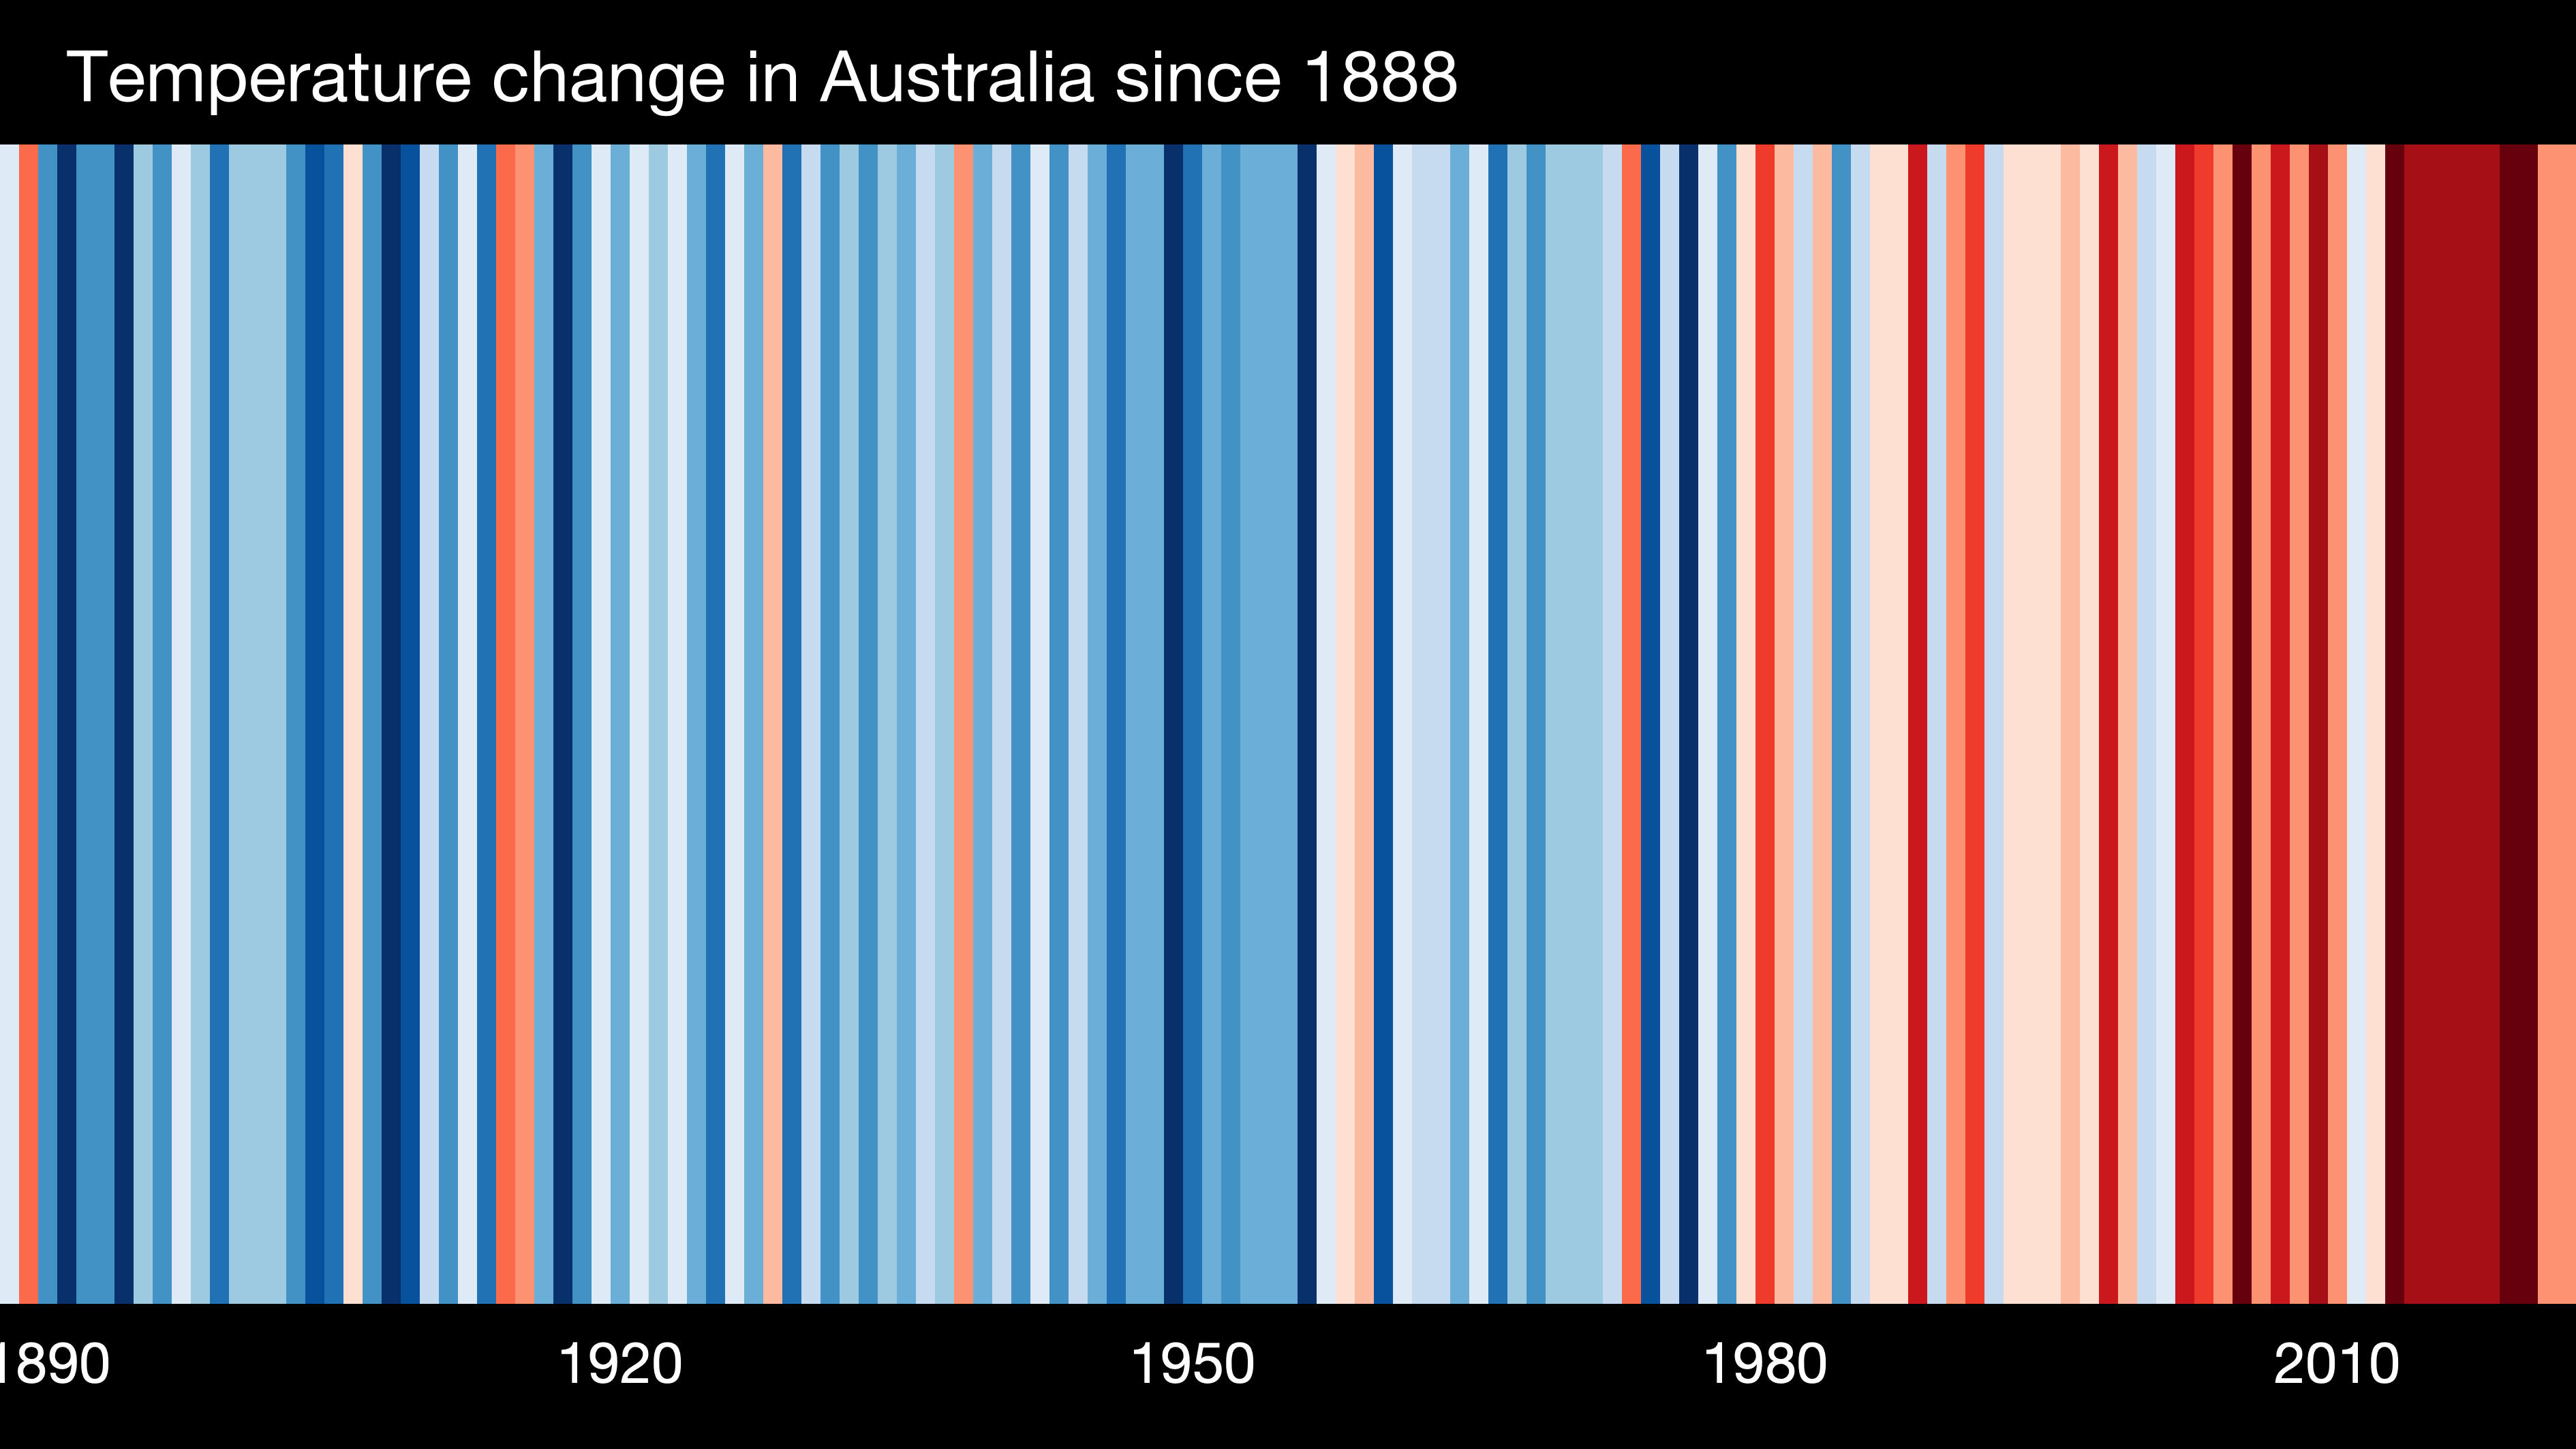
Each stripe represents the average temperature for a year. There are stripes available for every country in the world … as well as for every state in the United States. In most cases, you’ll see the stripes change from blue to red.
Where did these stripes come from? How did they become so ubiquitous?
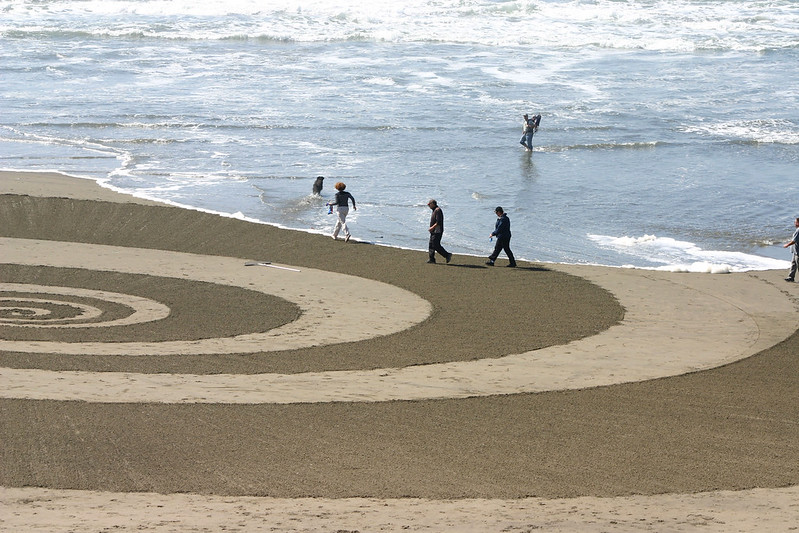
Circular Warming Stripes depicting mean global temperature (1900-2017) with concentric colored rings (by Emanuele Bevacqua, Ph.D. climate scientist affiliated with the University of Reading (U.K.), CC BY-SA 4.0 via Wikimedia).
Warming Stripes graphic on buses in Reading, UK (by km30192002, CC BY 2.0 via Wikimedia).
Stacked Warming Stripes showing annual mean temperatures for various countries (1901-2018), grouped by continent (by Ed Hawkins, climate scientist at University of Reading, CC BY-SA 4.0 via Wikimedia).


.png)