
By Celie Dailey
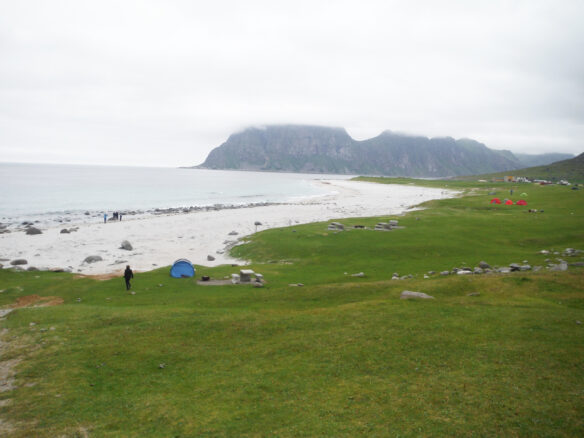
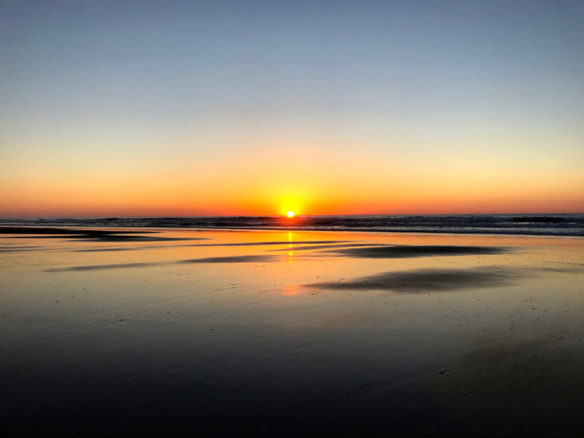
Artist Mary Edna Fraser lives on an intertidal creek in Charleston, SC. Although having depicted coastal regions around the world, it is this landscape that she knows best. Sitting on her dock at dead high tide, it was quiet on the evening of Saturday, August 27th as Hurricane Irene’s 600-mile wide reach churned offshore waters. (The eye of Irene had gone ashore earlier that morning, at Cape Hatteras about 450 miles to the north.)

Without much rain, the high tide was six inches from the bottom of her dock, a rare high water mark that coincided with a brilliant sunset. This peaceful moment provided a reflection on the potential power of storm surge—with a real hit from a storm at high tide, her home, at relatively high elevation in Charleston, and her eroding creekside bank, would be in danger. The downtown Charleston peninsula could face flooding of an even greater degree.
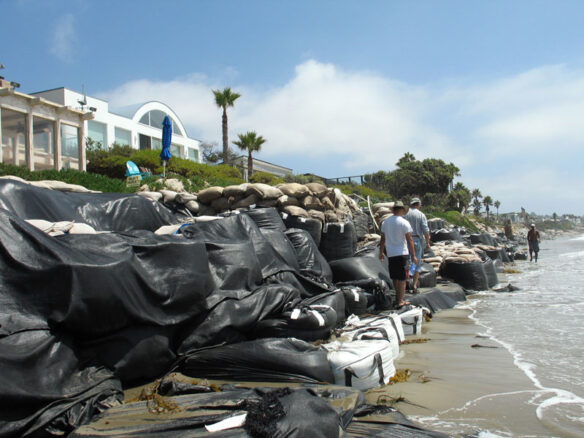
Much of the city of Charleston lies at about eight feet above sea level and when high tide (especially a spring high tide) combines with a little rain, flooding is rampant all over the city. Storm drainage systems run slowly and pools of water collect city-wide. A 1949 map of Charleston showing the original high-tide lines reveals that much of the city was actually marsh and estuary before it was filled in to create the 2 mile-wide downtown peninsula of today.
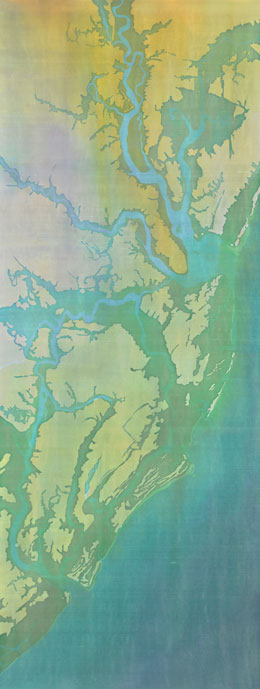
In “Charleston Airborne Flooded,” Mary Edna’s batik-on-silk rendition of the area that would be inundated by a 4.5-foot sea level rise, the water appears to mimic the original high-tide lines. The city still floods along these historic tidal creeks. A well-known area of flooding is Market Street, the location of the city’s outdoor market that spans several blocks inland from the Cooper River. During Hurricane Hugo in 1989, the open market became a rushing river. Originally the location of Major Daniel’s Creek, this area was used as a shipping canal until closed off by the construction of Governor’s Bridge in 1747. It was then that the wetlands began to be drained and built up to create more city lots.
Matt Pendleton, a spatial analyst with IMSG for NOAA Coastal Services Center in Charleston, SC prepared a map which shows projected sea level rise of 4.5 feet by the year 2100 which Mary Edna rendered in “Charleston Airborne Flooded.” To create the batik, Mary Edna brushed hot wax over the land that is lightest in color so that it would resist the dye bath that followed. She then dyed, in green, the area that would be inundated by the sea, seen along the land’s edges. Successive layers of removable wax and dye were used to build color and line in this illustration.
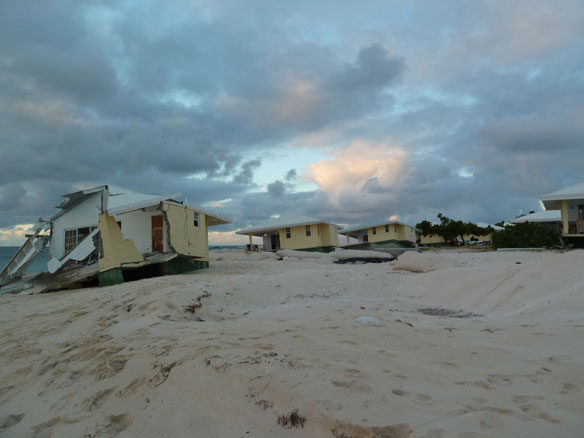
Charleston is by no means the worst off as far as susceptibility to sea level rise. So many cities were created by landfill, for example, the rims of Boston and New York. Miami tops the list as the world’s most vulnerable city (according to the value of threatened property). It sits atop porous limestone with no higher ground on which to migrate. For Miami, the options are to build a seawall at great cost or to abandon the city at even greater cost. Among the options for Charleston are marsh expansion projects, storm water retention ponds, elevated roadways, drainage canals, and seawalls.
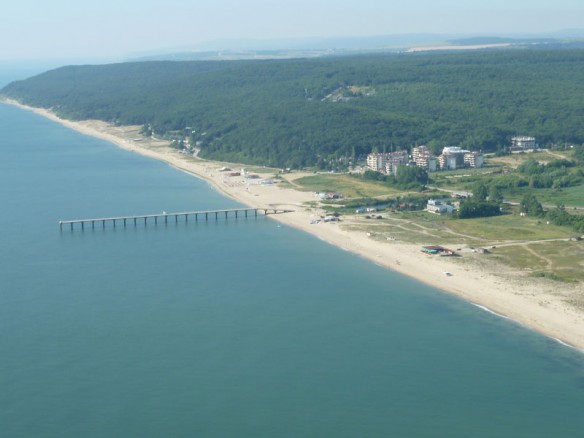
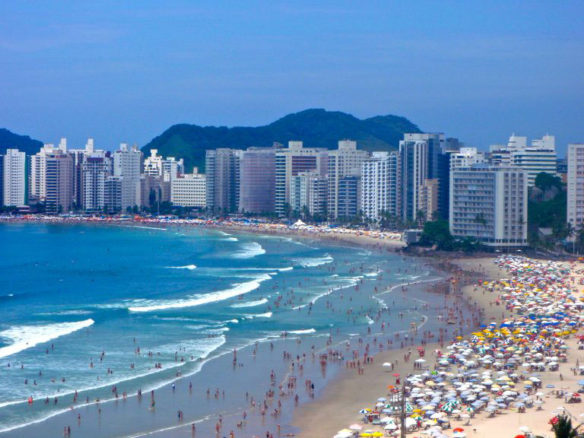
The flatter coastal planes of eastern North and South America make these margins more threatened by sea level rise than the west coasts with their higher and steeper coastal zones. Hurricanes add to this vulnerability in North America.
As sea level rises, the potential of tides and storm surge to penetrate further inland increases.
Mary Edna Fraser addresses many aspects of sea level rise with her art in Global Climate Change: A Primer, co-authored by Orrin and Keith Pilkey. Together, in a visually stimulating format, they present the fundamentals of climate change science, as well as uncover the politics of denial and address the human costs.
References:
Global Climate Change: A Primer, Orrin and Keith Pilkey, Duke University, 2011
Alfred O.Halsey Map, Preservation Society Of Charleston
Alfred O. Halsey’s Historic Charleston on a Map,1680 – 1949. Showing original high tide water lines, fortifications, boroughs, great fires, Historic information, etc. Compiled and delineated by Alfred O. Halsey, May 1949. Superimposed upon City Engineers map drawn by Jos. Needle – 1946.
Proprietary Records Of South Carolina, Vol.3
Visualizing Sea Level Rise to Engage Municipal Government Officials in Coastal South Carolina, NOAA