By William J. Neal,Emeritus Professor, Department of Geology, Grand Valley State University, Allendale, Michigan
Introduction
This narrative might be titled ‘What I’ve learned on my Summer Vacations.” From 2016 through 2020 our extended family has spent a week each summer on Beaver Island, the largest island in Lake Michigan. Most readers probably have heard of Mackinac Island, either for its strategic place in early American history, or as today’s high-end resort. In contrast, lesser known Beaver Island has a more colorful history, is more laid-back in terms of tourism, and for the most part is very eco-friendly (wildlife, birding, hiking trails, a kayaking water trail, inland-lake fishing, dark sky gazing), and natural beaches – that is beaches in their natural state (unraked, litter free, unfettered by coastal engineering). The nickname ‘America’s Emerald Isle’ is appropriate.
The island remains accessible only by boat, including a car ferry, or by plane, which explains in part why development has remained light. Sparse evidence shows that indigenous people visited the island in ancient times, perhaps as early as 3000 to 1000 B.C.. By the 17th Century, in the heyday of the fur trade, the Odawa culture occupied the island seasonally in support of hunting and fishing, with minor land clearance. Small Indian villages on Beaver, and associated islands, persisted into the 20th Century. But after the tribes ceded this part of Michigan in 1836, a gradual influx of white settlers began with traders, woodcutters, and mainly fishermen, including men from Ireland.
In the 1840s a new group of migrants brought about a major change in the island’s ecosystem. An offshoot group of Mormons moved onto the island, first as neighbors, but in 1850 – 1852 displacing the earlier Irish fishermen. The group’s leader, James Strang, proclaimed himself ‘king’ of the island, and their settlements included not just the St. James port/fishery, but outlying farm settlements with roadways cleared through the forest. As farmers they cleared the land, planted crops and apple orchards. These farmsteads remain as the open areas today, some still farmed, others abandoned but evolving into prairie-like areas. Strang pushed his followers too far, and in 1856 two of the brethren assassinated Strang. The Mormon colony broke up and moved, and the Irish came back strong.
Fishing remained a mainstay in the economy, but wood cutting was important. Even after the advent of coal-fired steamships, logging was an economic driver (cord wood, RR ties, construction lumber, even tamarack bark). Temporary rail lines were laid on the island in support of the timbering. In some cases, the beds of some of these lines were on ancient gravel beach deposits at the base of the old sea cliffs (e.g., West Side Road south of Fox Lake Road junction), and some of today’s roads were originally constructed on these abandoned rail grades (sequential land use). The island remains heavily forested, but there is little old-growth forest to be found.
One has to wonder if, during these times of extensive clearance of the forest, the runoff from the land increased? Were fossil dunes, stabilized by forest cover, reactivated, freeing sand supply? And if so, was more sandy sediment carried to the beach?
Beaches of Beaver Island – Sand and Gravel
The Index Map
(Figure 1) provides general locations of accessible beaches, and some related headlands (see Beaver Island Chamber of Commerce for more specific maps including trails for birders, hikers, kayakers, etc.). A brief description of each locale is provided for reference in the discussion of beach perspectives that follow.
- 1. Paradise Bay/St. James Harbor: This sheltered bay provides the natural protected harbor that has been the primary attractor for humans since the first indigenous fishermen worked the Beaver Island Archipelago. As Irish immigrant fishermen displaced the Indians, the settlement grew around the inner bay shore, and the village of St. James came to be. A sand shoal dominates a portion of the SW bay-shore, and there is a small recreational beach at the town park. Rounding out of the bay to the north, the shore is a wave cut terrace in bedrock, and the limited sand supply results in limited beach development. There are small beaches along parts of the north shore of the island, often gravelly, but the area is privately developed which limits access.
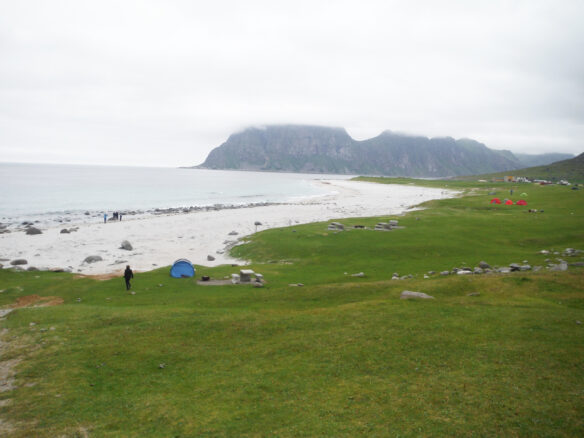
- 2. Little Sand Bay: This pristine beach, the author’s favorite, is an example where a sufficient sand supply led to the formation of a low dune field that supports a wider beach during times of low water, and sustains a narrow beach at high water. The 116-acre Little Sand Bay Nature Preserve includes 3500 feet of lake front, accessed by a 0.4 mi. (0.6 km.) trail from the Gallagher House through 5 distinct environments – open recovering farm fields with apple trees, cedar swamp, conifer forest, forested to open dunes, and an evolving beach as water level changes. At low water, some sections of the beach are marshes – great for frogs and common water snakes.
- 3. Sand Bay: This arcuate shore is the longest stretch of continuous beach front on the island at about 3 miles, although at high water there are obstacles where eroding vegetation blocks lateral access. Private development limits access, but there are points of access near the ends of the embayment, and once on the beach one can do a long beach walk. Low sand dunes are common along part of this reach. Central Michigan University has a campus for summer courses and biological research on the bay.
- 4. Cable’s Bay: At the SE corner of the island is about a mile of bay beach front with an access point at the north end. Cable’s Creek Road leads to the trail head to the beach. Although a short distance, the hike to the beach is rigorous, up and down a couple of steep-sided forested dunes, then crossing an open dune area of soft sand. But the view alone is worth the hike. The ‘banked’ sand supply of the dune field gives plenty of sand-supply ‘credit’ as the beach moves landward during high water times. This beach narrows but doesn’t disappear.
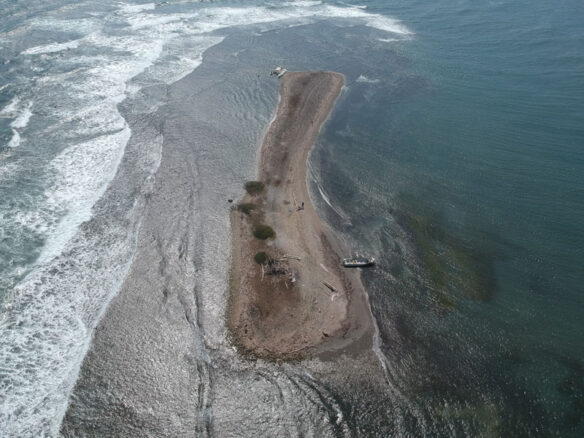
- 5. Kelly’s Point: A 700 to 800 ft. gravel bar is the ‘beach’ on this point as a result of the exposure to larger waves coming from the south, and consists of mostly broken fragments of the dolomite bedrock, or glacial gravels, as sediment sources. The water here is often turbid with suspended mud, and sand is limited.
- 6. Iron Ore Bay: The south shore’s most popular spot is on Iron Ore Bay at the Township beach. Backed by a huge supply of sand in high open dunes, and Iron Ore Creek flushing sand to the beach, the ample sand supply maintains this beach during all water levels. The prevailing west to east along-shore current shapes the beach into a barrier ridge extending east, forcing the creek to flow parallel to the beach ridge before breaching the bar. The shallow creek adds to the recreational value of the beach, particularly for children. But watching the bedforms take shape on the floor of the creek, and then migrating downstream can be intriguing to all. Although the bay front is on the order of 3/4ths of a mile, some of the beach fronts private property, so when walking the beach, one should go no farther landward than the high-water line.
- 7. Greene’s Bay: Access is limited to this embayment, McFadden’s Pt. being the most likely at the end of the dirt road. Although at low water the beach might continue for over a mile, the best beach during high water times is in the area of the Point and a short distance to the south. The Google Earth view is the best way to appreciate the associated dune field with blowouts that resemble those found on Michigan’s mainland shore. The beach narrows to the south.
- 8. Greiner’s Bay: The scalloped shoreline of the west shore of Beaver Island, with numerous points and headlands bounding small bays (some with pocket beaches), stand in sharp contrast to the long, arcuate bay shores of the east side. Greiner’s Bay, between Oliver’s Pt. and Left’s Pt., with a pocket beach along less than a mile of its northern reach, is a good example. Sand supply is limited, and this beach has narrowed significantly during the high-water stage.
- 9. Bonner’s Landing: Located in the southern portion of Eagles Bay where the regional shore returns to one of longer arcuate bays, this Landing area is a short zone of higher sand accumulation than the adjacent beach reaches. A short trail, leading off the dirt road, opens onto low, sparsely vegetated foredunes that provide a good sand supply to the beach, but it’s not clear why the larger sand concentration is located here. Possibly this is where two prominent directions of sand drift converge, or there’s a sandy zone in the glacial-drift cover that has acted as a local sand source.
- 10. McCauley’s Pt.: This sand-rich headland separates Eagle Bay, and Donegal Bay to the north. The sand accumulation to form the point suggests a south-to-north sediment transport, with perhaps a rocky substrate at the point acting as a barrier. Like the sand accumulation at the north end of Greene’s Bay, the McCauley’s Pt. sand abundance has led to a high parabolic dune with a central blowout moving into the forest at the back of the beach. A short trail provides access to the north side of the point, which has a narrow beach even at low water, so to see the big dune area, one has to walk the shore around the point.
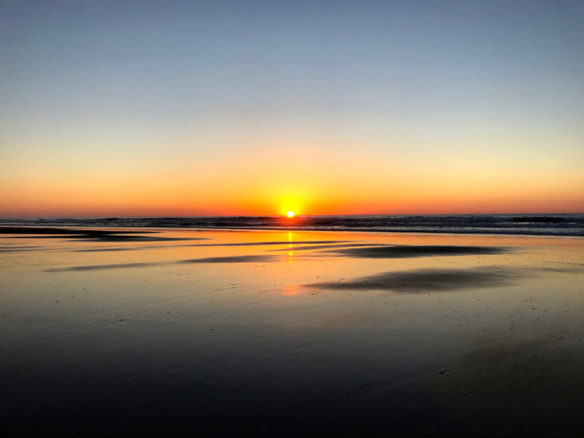
- 11. Donegal Bay: This bay on the island’s NW shore is the most visited during the day, and particularly in the evenings for the spectacular sunsets (Sunset Corner). Beach access is just off the road at this point. Again, this area has a healthy sand supply with a dune field, including one of the highest dunes on the island (Mt. Pisgah), a partially reactivated blowout, encouraged by foot traffic. Although the high-water beach is narrow, it persists as the shoreline migrates into the foredune. Development along this bay front is reducing aeolian return of sand shoreward.
Beach Perspectives
What can we learn from Beaver Island’s shores, whether they be sandy beaches, gravel beaches, wave-cut platforms, bluffs or cliffs? Our perspectives will depend on the scale of our view (from satellite/map views to landforms to bedforms to sand grains), to the time frames involved (millennia to centuries to days/hours/seconds), as well as the varied processes that have shaped the shores.
Five summers for a geologist yield the following:
- 1. Beaches are tied to geology – past and present:
A few 100 million years ago the area of today’s Beaver Island Archipelago was the floor of a marine ocean in which accumulating carbonate sediments would someday form rock units known as the Detroit River Group and Bois Blanc Formation. By the time the great Ice Age rolled around about 2.5 million years ago, these rocks had been uplifted along with associated weaker rock units that had been eroded into river valleys.
The lobes of the Pleistocene glaciers flowed down these valleys and eroded out todays Great Lakes basins, leaving the more resistant dolomites and limestones standing as topographic highs.These glaciers added their sedimentary record atop the rock formation. This veneer of glacial till, and outwash sands and gravels, is the primary sand source for the island’s beaches and dunes. As the glaciers receded, the ancestral Great Lakes formed, and the old topographic highlands now stood as islands. The post-glacial history of these ancestral lakes is complicated, but Beaver Island has evidence of about the last 9,000 years of lake evolution, starting with Lake Algonquin. For a millennium this lake stood higher than present, eroding the shores of the smaller island, reworking some sands and gravels, and producing a wave-cut cliff footed by a gravel beach (about today’s 720 ft. contour). As new outlets developed in other areas, these ancestral lakes drained, and by 7000 years ago they were at an all-time low, the Lake Chippewa stage. The archipelago was no longer islands, but part of the dry mainland. We can envision that as water level fell, sandy beaches formed, were reworked by waves and wind, and perhaps account for the great volumes of sand in today’s dunes on both the islands and the mainland – conditions and sand supply that no longer exist to replenish these dunes. Outlets changed again, water levels rose again, to form another high-stand, Lake Nipissing, about 4,000 yrs. ago. This lake’s elevation is listed as 643 ft. which corresponds closely to the topographic map’s depiction of the prominent fossil sea cliff along the west side of the island (Greenes’ Bay Bluff – Angeline’s Bluff). The large dune fields on the west side of the island (e.g., McFadden’s Pt. and Donegal Bay) may be associated with Nipissing history, and reflect a long history of prevailing winds from the WNW, and reworking of earlier sand deposits. Although the lakes are thought to have stabilized near their present levels about 2000 years ago, their history of change continues. Actual record keeping of water levels did not begin until the late 19th Century, and these reveal enough variation to impact on human activities. Figure 2 shows just a more recent 75-year span for Lake Michigan. Three features are striking: the rise and fall from highest to lowest is between 6 to 7 ft., and each of the last three high records was higher than the previous, and the change can occur in as little as 7 years.
- 2. Beaches respond to water-level changes:
A beach is a dynamic system, implying that any change in the processes or sediment supply will cause changes in the beach. In addition to changes in static lake level, waves also change water level although in a shorter time frame. In the case of falling lake level, a new beach will form just lakeward of the existing beach, and if the fall is gradual the additions will create a wider beach which in turn encourages dune growth. Similarly, a static rise will cause the beach to move landward, but also upward. If the rise is faster than the beach adjustment, inundation will occur, or the beach will narrow. But the disappearance of the beach is rare. When the weather person says there’s a storm, expect beach erosion, the erosion isn’t so much the beach as the land at the back of the beach (dune toe or sand bluff). Storm waves may inundate a beach, but when the storm abates, the beach is still there, sometimes wider and perhaps more landward than before. If there is no beach, inundation will occur, determined by the elevation and slope of the land. Figures 3 and 4 show the area of the NE corner of the island where the rise in lake level over a 7-year period flooded Gull Harbor Drive, and more extensively inundated the Gull Harbor Preserve. In contrast, Figure 5 shows a sandy shore with an ample sand supply that allowed the beach to advance landward in response to lake-level rise.
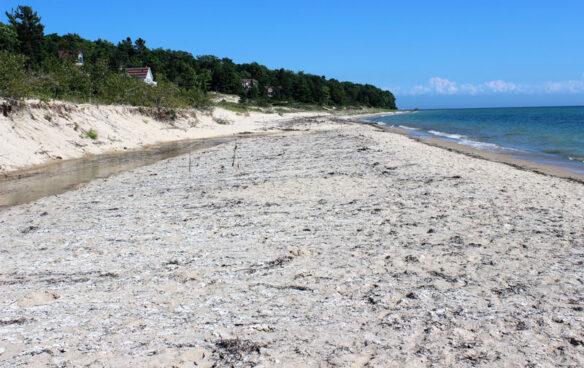
In the shorter time frame, the beach responds to water-level changes due to individual storms, or seasonally between extended stormy weather vs. times of low wave energy. Fall and Spring storms carry sand off shore to near-shore sand bars. The inner bar area sediment is moved on-shore during times of lower wave energy, with a sand bar welding onto the shore. The emergent bar produces a new berm with a trough between it and the previous dry beach face. If lake level is falling at the same time, a series of ridges and troughs results. The troughs trap finer sediment and organic wrack and are colonized by wetland vegetation, while the old berm ridges become ideal for pine seedling growth. The resulting lines of pine saplings looks like they were intentionally planted in rows. Subsequent storms push the lakeward beach ridge into the trough, filling the beach profile and providing a new sand surface to feed the foredune or next high-water storm ridge (Figure 6).
The rising lake level will erase these micro-landforms, but initially the old shorelines may still be seen as lines of dead tree with tops sticking out of the water, or as dark areas on the lake floor where the peaty organic sediments of the troughs are still present. Waves rework the sediments landward, maintaining the beach (Figure 7).
- 3. Beaches are directly dependent on sediment supply:
Beaver Island’s geology tells us that the island’s sand supply is ancient and finite. The bedrock will weather and erode to produce gravel, but little new sand. The primary source of sand in the beaches is from the old glacial sediments, existing dune fields which are also of ancient origin, and reworked beaches as lake level rises and falls. One can predict where the best beaches are by looking at Michigan’s critical dune areas map for the island: Donegal Bay and the area south of McCauley’s Pt., northern Greene’s Bay, and Iron Ore Bay. Other sandy beaches correlate with smaller, but substantial dune systems: Little Sand Bay, parts of Sand Bay, and Cable’s Bay (Figure 8). The dunes are sand in the ‘bank’ for beach withdrawals. No new sand is coming into the area, and in some locations development is cutting off natural recycling of sand. Houses built in the dune line, land-scaping, and building shore-hardening seawalls eliminate areas where dune/beach systems cycle from one to the other because the return sand supply to the beach is cut off or eliminated. Beaches in areas deficient in sand are already the first to narrow and in some cases disappear as lake level continues to rise. Some gravel beaches, those derived from glacial drift, have a limited sediment supply as well. Only the supply of carbonate gravels persist, but gravel bars and gravel storm ridges are not recreational beaches (Figure 9).
- 4. Beaches can be “read” in terms of sediments, landforms, and bed forms:
Just as the inland bluffs are a record of high lake levels of 1000s of years ago, and old gravel bars, different vegetation lines on old berms and troughs, and dune scarps are signs of events from decades to days ago, beaches can be ‘read’ in terms of more recent, short-term events (hours to seconds). Almost every small bed form found on ocean beaches is present on Great Lakes beaches. From wrack lines, to shell and heavy mineral placers, to rain drop impressions, ripples, crescents, rills, swash marks, and cusps. The difference from ocean beaches is that there is no tide, so the zone of formation of many structures is very narrow. Heavy mineral placers (Figure 10) are less common and thinner on Beaver Island than those of many mainland beaches, probably because of compositional differences in the glacial-drift source sediments, and the fact that some of the island’s beaches are protected from larger wave fetch. Where these dark-colored sands are absent, some bed forms are more difficult to see, such as ring structures and blisters (Figures 11 and 12). Escaping air and water, trapped in the sand at the time of deposition, produce the latter structures. Sand holes also are commonly produced by air and water escape. These form in a very narrow zone expect during storms, and the resulting bubbly sand deposit is often very soft due to the abundance of air holes (Figures 13 and 14).
- 5. Alien species, including humans, bring sequential changes that cascade through the ecosystem:
Invasive species are a significant part of modern Great Lakes history. Most are related to changes in the lakes biota, altered food chains, declines of native species, or alteration of water properties. The sea lamprey is one of the best-known examples through their impact on the game fishery, and the decades of trying to control their population. The potential entry of Asian Carp into the lakes is a more recent example, probably because they make for spectacular videos! Only a few alien species have had a direct influence on beaches. In the 50s’ and early 60s’ the alewife fish die offs resulted in large volumes of dead, rotting fish on the beaches – right around the 4th of July family visit to the stinking beach! And the Alewife preyed on young native fish species. The solution was to introduce another alien, Pacific salmon, to eat the alewife fish. And a new sports fishery developed, based on the salmon.
In the late 1980s both Quagga and Zebra mussels found their way into the lakes via disposal of ballast water from freighters, and provide an example of how the they induce changes that cascade through the ecosystem. These biofouling mussels received a lot of attention because they clogged water intake pipes, but their shells also became a common component of beach sediment (Figure 15), and they are found on most beaches either in the wrack line, or as selective sorted placers of shells. Again, these invaders adapted quickly to the ecosystem and displaced native bivalves. They also ate a lot of microscopic particulate matter, actually contributing to improved water clarity. Was that a good impact?
Apparently not. In 2016 one unpleasant surprise for family members occurred at Iron Ore Bay Beach when standing in shallower water. They were stepping on a slimy bottom that released bad-smelling bubbles of gas. On the nearby section of beach, the surface was covered with a thin dried mat; both the remains of algae (Figure 16).
After our trip we communicated with Professor Harvey Bootsma (University of Wisconsin at Milwaukee) who explained that quagga mussels do two things that promote benthic algal growth: 1.) by filter feeding on plankton, the mussels clear the water column, allowing more light to reach the lake bottom in the nearshore where the benthic Cladophora algae grow, and then 2.) the mussels recycle the nutrients from the plankton they eat. These nutrients, particularly dissolved phosphorus, become directly available to the algae that grow in close proximity to the mussels. In this way, the mussels are reallocating the phosphorus from the offshore to the nearshore, resulting nuisance algal problems.
The Point of These Perspectives
The sea-level rise gets the media attention, but outside of the Great Lakes region there is very little news of buildings falling into the lakes, roads being flooded, port facilities being compromised, or the political pressure being generated to do something to save buildings. A 7-foot rise in 7 years for Lake Michigan ought to grab a whole lot of people’s and politicians’ attention because it’s the perfect analogy for what ocean nations are looking at in terms of the coming losses from the sea-level rise.
Ironically, this is not new for the Great Lakes. Similar highs occurred in the 1950s, 1970s and 1980s, and to a lessor extent in the 1990s. All with property losses, extensive efforts by individuals as well as communities to combat property losses by building shore-hardening structures (seawalls, groins, bulkheads), most of which failed, and lots of pressure on officials to take some action (even FEMA’S NFIP was modified); each time at a very high economic cost.
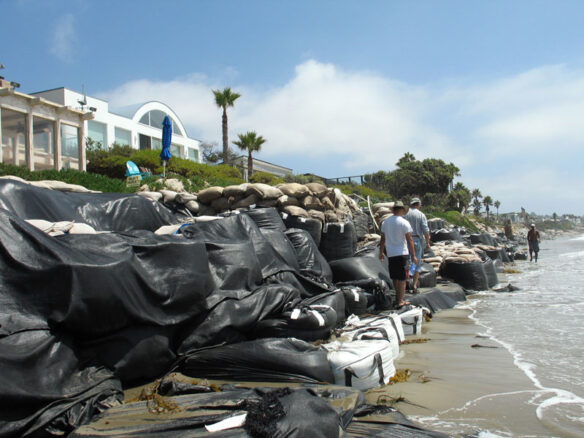
And Beaver Island is no exception. Houses built too close to the shore (either didn’t check past history or local evidence of previous high water), and now the same old shore-hardening ‘protective solutions’ are being adopted, when they’re known to have failed in the past. In 2020, locals told of rip-rap boulders being barged to the island for placement in front of property, only to sink as sand was washed out from around them, or their rearrangement by storms. And where property is successfully protected, it’s at the ultimate expense of loss of beaches and coastal aesthetics. Lots remain for sale where the water table is now near the surface, not places suitable for in-ground septic systems.
Change has been the rule for Beaver Island, and history shows that such change isn’t always for the best. Displacement resulted for many. Recent experience was the Chance to learn in regard to shoreline conservation. What’s next?
Figures Captions
Figure 1. Index outline map of Beaver Island with general reference locations by numbers: 1.) St. James Harbor — Paradise Bay, 2.) Little Sand Bay, 3.) Sand Bay, 4.) Cable’s Bay, 5.) Kelly’s Point, 6. Iron Ore Bay (Beaver Head Lighthouse is just east of Iron Ore Bay Beach), 7.) Greene’s Bay, 8.) Greiner’s Bay, 9.) Bonner’s Landing, 10.) McCauley’s Point, 11.) Donegal Bay.
Figure 2. Record of Lake Michigan water levels from 1945 to 2020. The red line is the average level over a longer time period and provides a reference to the relative record high and low levels. For the time span shown the record low was broken first in 1964 after a previous high in the early 1950s. High records were set again in the early to mid-1970s to be broken again in 1987, before dropping significantly and going below average from about 1999 to 2014, including a new record low in 2013. In just 7 years new record highs were approached in 2020. The total difference in water level elevation from record low-to-high approaches 7 feet. From USACE Great Lakes Water Levels (1918−2019): http://lre-wm.usace.army.mil/ForecastData/GLBasinConditions/LTA-GLWL-Graph.pdf
Figure 3. Two Google Earth images of the same southern part of the hook-shaped NE corner of Beaver Island. Note Gull Harbor Drive running left to right along the southern shore to a circular open area at lower right (Gull Harbor Preserve, a wet land during times of low water). A black star on the photos marks the position of the Information Sign shown in Figure 4, and black x’s mark the end points of that portion of the road flooded out after 2014-2015. A.) May 2012 — Note the wide land area between the road and the shoreline all the way around the lower right corner of the land area and north to the upper right part of the photo. The brown zone between the road/tree-line and shore is a wave-cut terrace in bedrock, covered in part by pebbles, cobbles and boulders. Note the absence of sand beach. By 2014 the shoreline had retreated over half way across the terrace, and by 2015 the locals renamed Gull Harbor Drive to Car Wash Road – park your car in front of the Preserve area and let the waves do the job. B.) July 2019 – the water’s edge had moved up the road to the driveway of the house (lower center) and completely flooded the Preserve. Note the submerged road at shore and the service road into the Preserve. Elsewhere along the shore to the north (toward X near top of photo), the road bed was completely washed out.
Figure 4. The information sign near the entrance to the Gull Harbor Nature Area provides a good reference point for lake level rise (Sign location shown by star on Figure 3 Google Earth images). A.) In 2016 the flooded road to right is Gull Harbor Drive and Lake Michigan beyond. B.) By 2017 the water level was to the feet of the sign with flooding up the service road (left), and standing water in parts of the marsh as the water table had risen in response to lake level rise. C.) By 2020 flooding of the entire marsh area was complete all the way to the landward pine forest tree line west of the marsh. Note the tree kill on what had been the last “high ground” before being flooded. (Photo by Jean Neal)
Figure 5. Two Google Earth images of Cable’s Bay Beach: A.) 2014 view while lake level was still near low, showing extensive rocky wave-cut terrace to right, and the public beach to left (note hiking access trail to beach). The beach/dune toe line is subtle, but the beach is wide and there is a well-developed foredune (unvegetated). Note the linear area of smaller trees in from the rocky terrace. This vegetation line probably represents the shoreline position at the time of the last high water (86’-87’ or 97’-98’). B.) 2019 view reveals complete flooding of terrace, and while the foredune area is narrower the beach is still there, having moved into the position of the previous dune toe. The beach is narrower, but every storm takes sand from the dune back onto the beach. The tree line back from the flooded terrace now has active beach migration into the tree stand. Sand supply to this part of the beach is being derived laterally.
Figure 6. Lobes of sand washed over the beach into the first trough (wetland). The trough may be filled or remain as a topographic low. Note small pines on the beach ridge. Little Sand Bay.
Figure 7. Flooding of the wetland and migration of the beach at the south end of Little Sand Bay from 2016 to 2020. Although the photos are not from the same spot, the tree tops pattern on the left in each photo provides reference points, as do a cluster of poplars at back of the 2016 wetland/beach. A.) 2016 B.) 2017 after significant flooding and beach retreat, C.) 2018 the wetland is gone but note there is still a good beach, although now considerably landward of 2016 position, and D.) 2020 beach has migrated into the area of young pines with tree kills, and poplars in background now falling into the lake. Portions of beach are now gravelly.
Figure 8. Cables’ Bay Beach in 2019. In spite of the rising lake level and erosion of the toe of the dune, the beach is still present, although narrow. The dune feeds the beach, and a year later the toe of the dune was several feet to the right, but the beach was still there. There was also more fine gravel on the beach.
Figure 9. Migrating gravel bar at Kelly’s Pt.. This SE locale faces more open water than the east side of island, and is subjected to higher wave energy over the bedrock terrace. A.) 2017 view of the fresh gravel bar, a trough with wetland vegetation, and an older gravel bar from an earlier episode of high water. Note the partially flooded vegetation to left of tree line. B.) 2020 approximate same view with the bar having moved landward, the trough narrowed, and the area to left of tree line completely inundated. Note that the bar was scarped by last storm (foreground).
Figure 10. Heavy mineral placer of dominantly black magnetite grains and pink/red garnet sand grains. Such concentrations of these higher density minerals on the upper beach is the result of density sorting by storm wave swash.
Figure 11. These ring structures on Donegal Bay beach would be difficult to see if they had not formed where there were thin alternating layers of light quartz sand and dark heavy mineral laminae. Note faint swash marks at bottom of photo from the leading edge of swash wave.
Figure 12. Blister structures form due to trapped air trying to escape and creating a souffle-like swellings. A.) blister on beach surface, Donegal Bay, B.) cross-section of blister.
Figure 13. Sand holes and sea gull’s footprint for size comparison.
Figure 14. Bubbly sand exposed in vertical face of a small beach scarp, Sand Bay beach, cut by last storm (after the deposition of the bubbly sand layer). Note abundant holes and cavities. (Photo by Lucie Hertstein)
Figure 15. Concentrations of mussel shells on Little Sand Bay beach, 2017. A.) The white streak is a deposit of zebra and quagga mussel shells concentrated in the swash zone of the beach. B.) Closer view of the abundant mussel shells with a few small snail shells as well. (Penny for scale)
Figure 16. Algae, washed up on beach during storms, dries to a thin crust covering the beach. A.) Iron Ore Bay beach covered with such a crust. Note Iron Ore Creek at back of beach is held parallel to shore by beach bar due to W to E alongshore drift. B.) Close up of the lighter algal crust, split up on shrinkage.
Credits: