


 and oiling characteristics (lower) of station GWS-9")


.")


By Miles O. Hayes and Jacqueline Michel, Research Planning, Inc.
Introduction
The purpose of this discussion is to describe the geomorphology and dynamic coastal processes of the sand beaches along the northeast coast of Saudi Arabia. As shown on Figure 1 (See above gallery), the study area extends from the Kuwait border to the southern end of Abu Ali. This is, in effect, the shoreline oiled during the Gulf War oil spill of 1991, the largest oil spill in history (11 million barrels). In 2002 and 2003, twelve years after the original spill, our field team determined that eight million cubic meters of oiled sediment remained on the shoreline, mostly in oiled crab burrows in the sheltered marshes and tidal flats. There was still some oil on the sand beaches, as will be discussed below.
The work described in this paper was conducted during two main field projects. Starting in January of 1992, our team participated in a study to determine the immediate impacts of the Gulf War oil spill that was sponsored by the National Oceanic and Atmospheric Administration (NOAA). This work included participating in the cruise of the NOAA R/V the Mt. Mitchell. In addition, at that time, 17 permanent beach profile stations were established that were monitored up through 1997. John Robinson was the contract monitor for the Mt. Mitchell portion of the project. Also, the Marine Spill Response Corporation (MSRC), with Don Aurand as contract monitor, provided support for the beach monitoring work. In 2002-2003, we directed a six-month field project to determine the long-term impacts of the Gulf War oil spill in the study area (Figure 1) with funding from the United Nations Compensation Commission. During this project, 3,107 intertidal transects were surveyed. Throughout all this work, we were grateful for the guidance and support of the Presidency of Meteorology and Environment (PME) of the Kingdom of Saudi Arabia.
Physical Setting
General
The Arabian/Persian Gulf is shallow, with an average depth of 35 meters (m) and a maximum depth of around 100 m. Rainfall is meager (50 centimeters [cm]/year) and evaporation rates are high, resulting in salinities averaging up to 38-41 parts per thousand (ppt). The ocean waters that enter the Gulf through the Strait of Hormuz generally flow to the northwest, hugging the shoreline of Iran under the influence of the Coriolis Effect (i.e., deflected to the right in the northern hemisphere). Some fresh water enters the Gulf at its northern end at the Shatt Al Arab.
“ On the exposed outer sand beaches of the study area, sand-sized particles, composed predominantly of quartz, carbonate shells, and coral fragments, are the most common sediment type.”
— Miles O. Hayes & Jacqueline Michel
Water exiting the northern end and flowing south is also deflected to the right, such that the surface flow trends southeast along the Saudi Arabian Coast, continuing on into waters of the United Arab Emirates, where the long-term evaporation of these waters has created some of the highest salinities in the Gulf. Salinities up to 70 ppt sometimes are recorded in the Gulf of Salwa, 200 kilometers (km) southeast of the southern border of the study area (Meteorology Environmental Protection Agency (MEPA), 1987).
The climate of the study area is hot and dry. The air temperature averages 37°C in August and 12°C in January. Water temperatures range from 15 to 33°C, a large range that is a result of the shallow and almost landlocked character of the adjacent waters (MEPA, 1987).
It is important to note that this shoreline is subject to neither tropical nor extratropical cyclones, nor are major impacts of the monsoon of importance. This fact makes this area somewhat unique in comparison with other coasts around the world.
Because of its shallow nature, the Gulf has undergone some major changes during the ice ages (Pleistocene epoch), in that during each of the four major glaciations, the Gulf essentially went dry. During the last one, the Wisconsin Glaciation, which peaked about 20,000 years Before Present (BP), sea level dropped as much as 120 m. Sea level started to rise about 12,000 years BP, and reached its present level around 5,000 years BP (with regard to the ocean surface; not necessarily with respect to the adjoining land mass). Consequently, the landforms along the present Gulf shoreline are relatively young, in a geological sense.
Geology/Geomorphology
The Gulf area is a low-lying area adjacent and parallel to a mountain belt formed as a result of the collision of two tectonic plates, the Arabian and Eurasian Plates (Figure 2). The Arabian/Persian Gulf is the marine portion of an extensive peripheral foreland basin formed as the Arabian and Eurasian Plates collided during the Zagros Orogeny, which took place in Plio-Pleistocene time (23 to 2.6 million years BP) (Lees and Falcon, 1952; Dickinson, 1974; Jordan, 1981). Up to the present time, the rivers in the north have filled in about half of the former Gulf with sediment, meaning that, if this process continues, the Gulf as we now know it will be no more after around another 10 million years or so.
Tides
Tides and the associated tide-generated currents are the most important dynamic physical process affecting sediment distribution and transportation in the sheltered bays of the study area. The tides are surprisingly complex in the Gulf (Defense Mapping Agency USA, 1975). They are driven by two amphidromic systems, the margins of which meet in the study area. From one spring tide to the next, the tides commonly range from semidiurnal to highly mixed and, at times, approach a diurnal configuration. Thus, complicated patterns of high and low tides, as well as asymmetric current patterns, occur within the area discussed here (Figure 1; referred to as the study area in the following discussion). During our research on the Saudi Arabian Coast, that continues to this day, tide-level conditions drive the scheduling of all fieldwork, inasmuch as the daily field surveys are conducted under optimum low-tide conditions.
The mean tidal range decreases along the western coast of the Gulf from 3 m at Kuwait to 1 m at Ras Tanura, Saudi Arabia (Defense Mapping Agency USA, 1975). Although the tidal range of the study area typically averages around 1.5 m, the intertidal flats in the region are extensive, reaching over 2 kilometers (km) wide in places, a phenomenon found most commonly in macrotidal areas (tidal range greater than 4 m). The wide intertidal zone is a result of the relatively flat hinterland and the shallow character of the adjacent Gulf floor.
Tidal currents are strong in the major tidal channels of the study area, with maximum velocities of 0.5-0.8 m/second (s) occurring frequently. Current data recorded by current meters established in the study area by Hayes, Michel, and Montello (1993) showed that ebb currents typically are stronger than flood currents in Dawhat al Musallamiyah and vice versa in Dawhat ad Dafi, two bays in the southeast corner of the study area. This difference probably is a result of the contrast in the morphology of the two bays, but this phenomenon has not been investigated in detail.
Shamal Winds
The meteorological explanation of Shamals, which blow consistently out of the northwest (see wind roses for Mina al Ahmadi, Kuwait and Ras Tanura, Saudi Arabia in Figure 3) and may occur throughout the year, is beyond the scope of this discussion. However, they are particularly strong in the late spring when dust storms are common (Edgell, 2006). Also, a winter Shamal is associated with the strengthening of a high pressure over the Arabian Peninsula after the passage of a cold front while a deep trough of low pressure maintains itself over areas east of the Arabian/Persian Gulf (see general model in Figure 4). This leads to strong northwesterly winds over the Gulf for periods up to five days (El-Baz and Makharita, 1994).
Waves and Longshore Sediment Transport
There are limited data on the wave conditions along the coastline of the study area. Field studies in Kuwait by RPI (1977) documented maximum heights of breaking waves to be less than 1 m. Wave heights obviously increase to the south along the Saudi Arabian Coast as the fetch in a northwesterly direction increases. The island of Abu Ali has an open fetch of 250 km to the north. Breaker heights greater than 1 m should be common on the headlands in the study area.
“ …this shoreline is subject to neither tropical nor extratropical cyclones, nor are major impacts of the monsoon of importance. This fact makes this area somewhat unique in comparison with other coasts around the world…”
— Miles O. Hayes & Jacqueline Michel
However, breaking waves greater than about 60 cm in height rarely were observed during our field surveys in 2002-2003. During the late spring and summer months, when strong Shamal winds usually occur, the waves also tend to be consistently larger, although according to Reynolds (2002), “The winter Shamal occasionally sets in abruptly with great force and speed above 10m/s, and gale force Shamals occur once or twice each winter and bring the strongest winds and waves of the season.” Our detailed field surveys were carried out between late September 2002 and early March 2003.
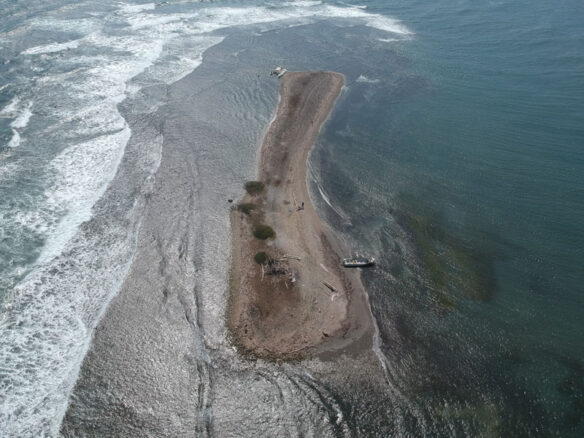
There is significant geomorphic evidence to suggest a dominant northwest-to-southeast longshore sediment transport direction along the Saudi Arabian Coast. There are a number of major depositional headlands, some of which are cuspate spits that have associated sand spits that trail off to the southeast. The general model and a typical example of one of these cuspate spits is illustrated in Figure 5.
Also, as observed while reviewing the aerial videotape of the shoreline of the study area taken as part of our field survey during October 2002, a number of crenulate bays show a classic fish-hook shape with the hook shank extending to the east or southeast, indicating sediment transport in that direction. Numerous other features observed on the videotape, such as oblique nearshore bars, rhythmic topography, natural groins, and other sedimentation patterns (e.g., subtidal sand flats with abundant large sand waves that project to the east and southeast away from the onshore spits) also reflect the dominant southeasterly longshore sediment transport direction. The cuspate spit headlands near the Kuwaiti border are more symmetrical than the ones to the south and are separated by sandy arcuate embayments, which is a reflection of the more limited fetch from the north along the Kuwaiti shoreline. This change in the cuspate spit shapes and orientations is illustrated in Figure 3.
Beach Sediments
On the exposed outer sand beaches of the study area, sand-sized particles, composed predominantly of quartz, carbonate shells, and coral fragments, are the most common sediment type. All eight of the outer sand beaches studied during the Mt. Mitchell scientific expedition in early 1992 were composed of medium – (0.25-0.5 millimeters [mm]) to coarse-grained (0.5-1.0 mm) sand (Hayes, Michel, and Montello, 1993). The mean grain size of the sediments on exposed outer sand beaches is 0.7 mm, and these sediments have the highest degree of sorting of all habitats that were studied.
Beachrock, Sabkhas, and Algal Mats
Beachrock is sediment consolidated into solid rock recently (relative rapid process) by the precipitation of calcium carbonate from sea water into the pore spaces between sand grains, a process enhanced by warm water and high salinities. Beachrock is very abundant in the intertidal and shallow subtidal areas all along the western shoreline of the Gulf.
Coastal sabkhas are very flat, supratidal surfaces that typically border the high spring tide line, being flooded occasionally during exceptionally high spring tides and storm surges. They are typically composed of carbonate mud sediments and wind-blown silt and fine sand of variable composition. These sediments typically contain an abundance of evaporite crystals, such as halite and gypsum.
Algal mats are sheet-like accumulations of blue-green algae (Cyanobacteria) commonly developed in intertidal environments in the Gulf. The algae cover the sediment surface and will in turn trap sediment to produce a laminated alternation of dark, organic-rich algal layers and organic-poor sediment layers. They commonly form a band in the mid to upper intertidal zone around sheltered bays. They are an important food source for some organisms. Some examples of these rather diversely shaped mats are pictured in Figure 6.
Wave Exposure
The 3,107 intertidal transects surveyed during our 2002-2003 survey were sorted into categories based on exposure to wave action and coastal habitat type. Coastal biologists long have used the concept of exposure to differentiate among coastal habitats, a classic reference being Ricketts et al. (1985). Also, exposure is used as a means of delineating the sensitivity of coastal habitats to oil pollution, with the most exposed habitats being least sensitive and the most sheltered being most sensitive (Hayes, Gundlach, and Getter, 1980). Accordingly, the coastal habitats of the study area were so classified. In this discussion, we will focus on the exposed outer sand beaches, moderately exposed sand beaches, and sandy tidal flats.
Generally speaking, all of the stations classified as exposed have open fetch distances measured in tens of kilometers. Sediments on these transects are medium- to coarse-grained sand (or gravel in some areas) that is subject to considerable wave action. The moderately exposed stations typically have fetch distances confined within the bays and the sediments, while still either sand or muddy sand, tend to be finer-grained than those on the more exposed transects. Most of the transects we classified as sheltered have open fetches less than 2 km and the sediments are either pure mud or sandy mud.
During the fieldwork, it was clear that exposure of the habitat had played a major role in the retention of oil within the sediments along the transects. A search of the literature revealed that wave data needed to make a distinction among exposure levels of the individual transects were not available. Accordingly, an index of wind-wave exposure in the northwestern Arabian Gulf was derived by our team using a raster wind-wave model. The details of the model are given in RPI (2003).
Exposed Outer Sand Beaches
Description
The sand beaches that occur in the exposure zone referred to as exposed extend along 141 km of shoreline and occur on 564 of the 3,017 transects (19%) surveyed in the impacted area during our 2002-2003 surveys. They represent 22% of all sand beaches.
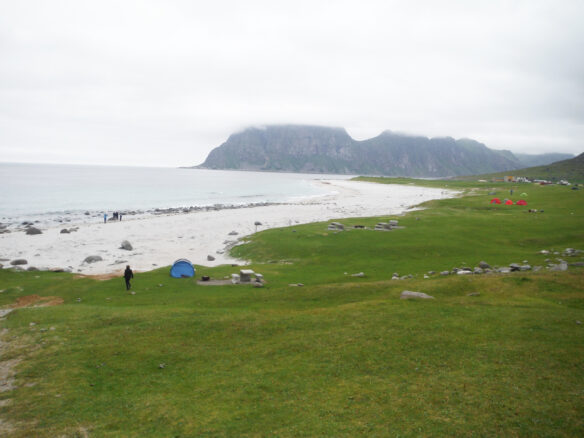
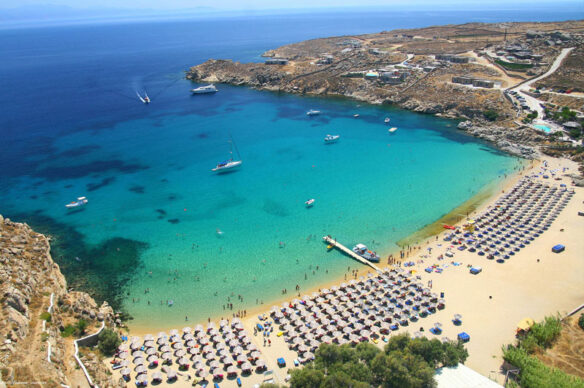
Although wave data for these areas are lacking, the beaches are clearly exposed to frequent episodes of intense wave action, judging from the relatively large size of the beach berms, the excellent sorting of the sediments, and the presence of erosional and depositional features on the beaches. Examples of aerial views of these beaches are given in Figure 7.
Morphology and Sediments
A beach develops where sediment particles are available and waves are large enough to mold the sediments into a depositional berm. The exposed, outer sand beaches of the study area typically are made up of three basic morphological components:
- Berm top: A landward-sloping (0-5 degrees), smooth surface that is washed over during high spring tides and during periods of heavy wave activity.
- Beachface: The seaward-sloping (3-12 degrees), smooth face of the berm that is subject to the uprush and backwash of the waves at mid- to high-tide levels.
- Low-tide terrace: A gently sloping (1-3 degrees) surface exposed at low tide that may contain complex sandbar systems. This surface merges almost imperceptibly into a wider sandy tidal flat in many locations.
These components of exposed sand beaches are illustrated by the generalized topographic cross-section given in Figure 8. Such beaches are characterized by episodes of both erosion and deposition.
” In places, the accretion rates were quite impressive… The potential for burial of oiled sediment layers as much as tens of centimeters is possible on such beaches.”
— Miles O. Hayes & Jacqueline Michel
During periods of high wave activity, sandy sediments deposited on the berm during periods of lesser waves are eroded off the berm and deposited on the offshore tidal flat or perhaps even into the subtidal area further offshore. The sand thus displaced offshore of the high-tide area is returned during calmer weather in the form of intertidal bars (see Figure 8). Thus, the potential for burial of oiled sediment layers as much as tens of centimeters is possible on such beaches.
On the exposed outer sand beaches of the study area, sand-sized particles, composed predominantly of quartz, carbonate shells, and coral fragments, are the most common sediment type. All eight of the outer sand beaches studied during the Mt. Mitchell scientific expedition in early 1992 were composed of medium- (0.25-0.5 mm) to coarse-grained (0.5-1.0 mm) sand (Hayes, Michel, and Montello, 1993). For that study, the mean grain size of the sediments on exposed outer sand beaches was 0.7 mm, and these sediments have the highest degree of sorting of all habitats that were studied.
Oil Distribution and Characteristics
A field sketch of an exposed outer beach located approximately 10 km north of Ras az Zawr is given in Figure 9, and its topographic profile and oiling conditions one year after the spill are given in Figure 10. Hayes, Michel, and Montello (1993) estimated that 60% of the oil deposited on the outer beaches north of Ras az Zawr (northwest half of the shoreline in study area) had been eroded away 1 year after the spill. However, at this particular station, two layers of buried oiled sediments from the 1991 oil spill were still present in March 1992, one year after the spill.
Although the oil distribution patterns on the outer sand beaches showed considerable variation along the shore, in our 2002-2003 surveys we noted that there were three basic patterns that dominated twelve years later:
- (1) Much of the oil originally deposited on these beaches had been eroded away by wave action during the twelve years following the spill.
- (2) In areas where the beaches were undergoing long-term accretion, the oiled sediments had been buried.
- (3) Heavily oiled beachface sediments had been consolidated into asphalt pavements in a few places, some of which was still exposed on the surface of the beachface.
Of the 564 transects classified as exposed outer sand beaches, 280 (50%) contained no visible oil at the time of our survey in the fall and winter of 2002/2003. Based on a study of satellite imagery and shoreline surveys conducted by MEPA (1991), most of these beaches were oiled during the 1991 oil spill. Therefore, it is assumed that in the areas that contained no visibly oiled sediments, the oiled sediment has been removed by wave action, a process that was observed during the 1992 and 1993 Mt. Mitchell surveys (Hayes, Michel, and Montello, 1993; Michel et al., 1994).
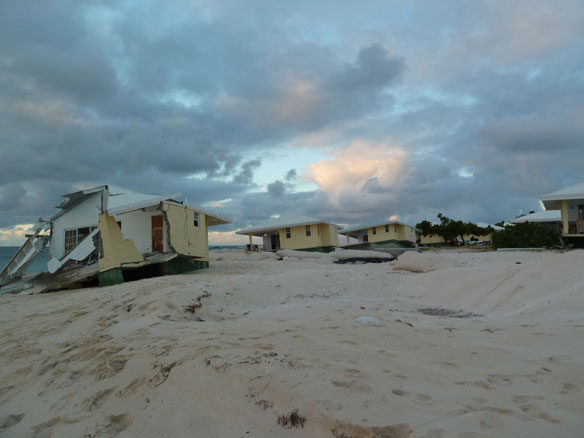
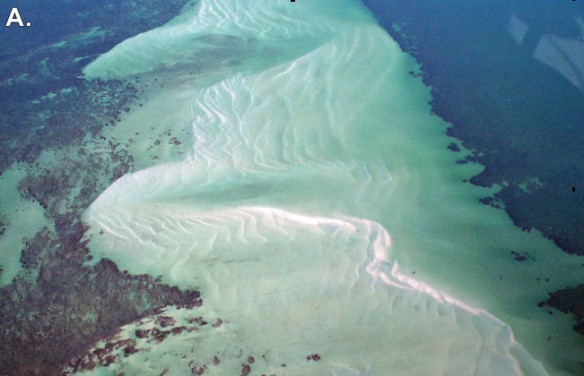
Though depositional patterns on these beaches were not studied in detail during the 2002-2003 surveys, at least half of them appeared to be undergoing long-term accretion, which had led to burial along transects where the oiled sediment was not eroded away within a few years after the spill. As noted earlier, the accretion of the beach is accomplished by the welding of intertidal bars onto the beachface/berm areas in the upper intertidal zone. This process is aided by the progressive alongshore migration of massive wedges of sand called rhythmic topography, an example of which is pictured in Figure 11A. An aerial view of a small shoreline rhythm and a welding intertidal bar is shown in Figure 11B. In places, the accretion rates were quite impressive. For example, at Mt. Mitchell station GWS-8, the backbeach area was erosional in January 1993, as is shown by the beach sketch in Figure 12. However, ten years later in January 2003, this beach had accreted 30 m (Figure 13). This resulted in burial of oiled sediment, such as that illustrated in Figure 14.
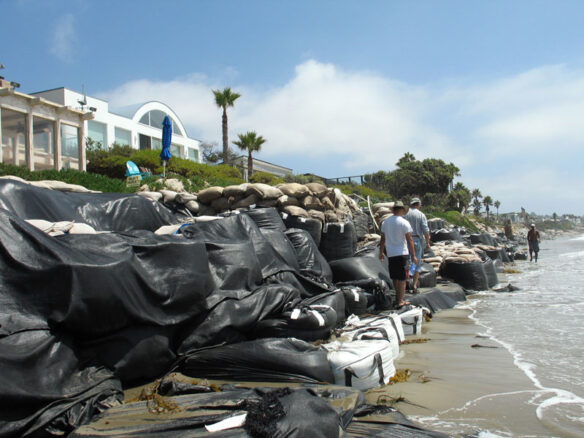
Asphalt pavements of at least two distinct origins were encountered in the study area in 2002-2003. A very hard, solid black pavement of oil derived from the Nowruz spill of 1983 essentially blanketed the intertidal zone of the exposed outer beaches on Abu Ali Island (Hayes, Michel, and Montello, 1993). The pavements formed from the 1991 oil spill typically were softer than the Nowruz pavement, were lighter in color (medium brown), and contained a significant amount of sediment. Photographs of these two types of pavement are given in Figure 15. Most of the asphalt pavement located north of Ras az Zawr was visually determined to be pavement from the 1991 oil spill (see photograph in Figure 15B), and generally speaking, it did not have either the continuity or the consistency of the Nowruz pavement. The longest continuous band of 1991 oil spill pavement, approximately 5 km and averaging 10 cm thick, coated the entire intertidal zone of the beach just south of the Prince Sultan Beach Resort.
Moderately Exposed Sand Beaches
Description
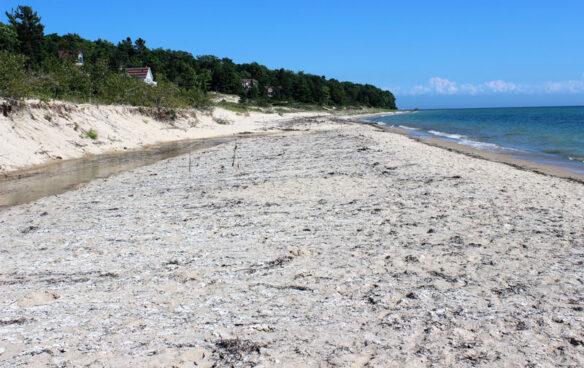
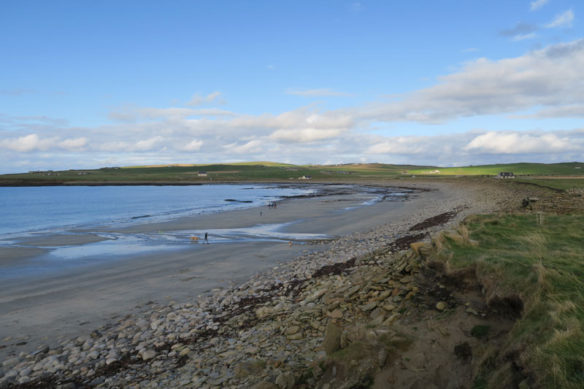
The sand beaches that occur in the exposure zone referred to as moderately exposed extend along 406 km of shoreline and occurred on 1,625 of the 2002-2003 transects. They represent 78% of all sand beaches in the study area. Although, as noted earlier, wave data for these beaches are lacking, they are clearly exposed to less frequent episodes of intense wave action than the outer exposed sand beaches, judging from the relatively smaller size of the beach berms, and the absence of clear-cut erosional/depositional features on the beaches. Ground views of two of these beaches are shown in Figure 16.
Morphology and Sediments
These beaches have a morphology similar to the exposed outer sand beaches in that they contain a berm with associated berm top and beachface, and an adjacent tidal flat that may contain intertidal bars. However, the berms on these beaches, which are located on shorelines more sheltered than the outer beaches, are much smaller. Also, because of the smaller waves, changes in morphology are slower and more subtle. Usually the tidal flats adjacent to these beaches are very wide, because they typically are located in bays with shallow depths. A general model of this beach type is given in Figure 17.
Similar to the exposed outer sand beaches, sand-sized particles, composed predominantly of quartz, carbonate shells, and coral fragments, are the most common sediment type. Grain size of sand in the study area is complicated by the fact that a significant portion of it is blown from the desert onto the shore where it mixes with sediment derived from other sources, such as erosion of rocky headlands. Therefore, in this area the environmental setting itself is not as important in determining the grain size of the sediments as it is on most shorelines. Three of the four moderately exposed sand beaches studied during the Mt. Mitchell scientific expedition in early 1992 were composed of medium-grained (0.25-0.5 mm) sand (Hayes, Michel, and Montello, 1993). In the 2002-2003 study, the mean grain size of the sampled beaches was 0.7 mm, or medium-grained sand, the same as the exposed outer sand beaches. However, the sand on the moderately exposed sand beaches is less well sorted, with a sorting coefficient of almost 6, compared to 3.5 for the exposed sand beaches. The mean grain size of the sand on all sand beaches in this area is similar because the sand is derived from the same sources, and wind-blown sand is a major contributor. The moderately exposed sand beaches have poorer sorting because the finer-grained sediments are not as frequently winnowed out by large waves.
Oil Distribution and Characteristics
Along the 406 km of moderately exposed sand beaches, 166 km (41%) were free of visibly oiled sediments whereas 240 km (59%) contained oil at the time of our survey in 2002-2003. The volume of oiled sediments was estimated to be about 632,500 m3, representing about 8% of the total volume of oiled sediments in the study area. Because the degree of exposure is lower than on the outer beaches, infauna can be more common. As a result, oiled burrows represented nearly 16% of the oiled sediments (compared to 0.2% on exposed sand beaches). An example showing the preservation of oiled burrows is given in Figure 18. Also, it is apparent that on these moderately exposed sand beaches, the rates of natural removal and burial of the sediments oiled during the 1991 oil spill are relatively minimal.
Highly Exposed Sandy tidal Flats
Description
According to MEPA (1987), a total of 92% of the area of the intertidal zone (at low tide) of the east coast of Saudi Arabia is occupied by intertidal flats. The mapping results of our 2002-2003 study show that 87% of the intertidal zone of the study area consists of tidal flats, by far the most abundant habitat type, with the possible exception of the sabkhas, which have an essentially limitless landward extent; hence, their areal extent was not measured. Based on the transect data from our 2002-2003 surveys, exposed sandy tidal flats were present on 300 transects and thus 75 km of coastline.
” Liquid oil in burrows was found in a number of localities during the 2002-2003 surveys, twelve years after the spill…”
— Miles O. Hayes & Jacqueline Michel
Morphology and Sediments
The more highly exposed pure sand flats, such as the ones pictured in Figure 19, show evidence of relatively high wave and/or tidal current action. Their sediments are coarse-grained sand (mean = 0.68 mm), which is typically well sorted. Many of these flats contain mobile sand waves and megaripples (e.g., Figure 19A).
Oil Distribution and Characteristics
For the most part, these highly exposed flats did not typically contain an over abundance of oiled sediments during our 2002-2003 surveys, because of the high level of sediment motion under the influence of waves and tidal currents, as well as the thin nature of the sediments over the underlying beachrock terrace. Of the 300 transects that included exposed sandy tidal flats, oil remained on 136 transects (45%). Reported another way, of the 75 km of shoreline that included exposed sandy tidal flats, 34 km contained oil residues. Exposed sandy tidal flats occurred more frequently than these statistics show, because the transects terminated at the end of the oil. Thus, the presence of an exposed tidal flat seaward of a beach that was visibly clean would not be recorded; nor when the visible oil ended before reaching the tidal flat.
Moderately Exposed Sandy Tidal Flats
Description
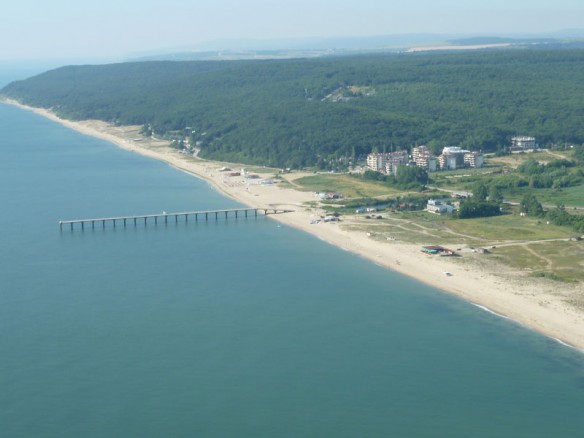
A typical example of moderately exposed sandy tidal flats is shown in the aerial photograph in Figure 20. A field sketch and topographic profile of the site shown in that photograph, produced during the Mt. Mitchell field survey in March 1992, are given in Figures 21 and 22. In 1992, the oiling of this transect extended from the high-tide line offshore for over 300 m. Note the occurrence of multiple sand bars on the middle and outer portions of the flat. It is also clear from the aerial view that the halophytes, which previously occupied about 70 m of the upper sand flat, had not recovered at that time.
Sediments and Oiling
Twenty-three of the 24 sediment samples collected during the 1992 survey on moderately exposed sandy tidal flats studied were composed of either medium-grained (0.25-0.5 mm) or fine-grained (0.125-0.25 mm) sand (Hayes , Michel, and Montello, 1993). In the 2002-2003 study, the average grain size of the sediments on moderately exposed sand flats was 0.48 mm, or medium-grained sand, and the sand was moderately well sorted.
The oiling characteristics of the moderately exposed sand flats changed slowly over time. As seen, for example, on the Mt. Mitchell transect GWS-VII, which was discussed above and is described in Figures 20-23>. The general oiling characteristics of transect GWS-VII changed little between 1992 and 1993. In fact, the hardening of the surface of the oiled bars on the flat made the site look even more impacted two years later. As shown by the photograph in Figure 23, footprints made during the previous year’s survey were still preserved on the oiled surface of the flat. The liquid oil in the crab burrows had been sealed over and was still in a liquid state 2 years after the spill (see Figure 24). Liquid oil in burrows was found in a number of localities during the 2002-2003 surveys, twelve years after the spill.
Water Level Concerns
Future Rise in Global Sea Level
Any consideration of the characteristics of the sandy beaches and tidal flats of the study area should involve some consideration of future changes in sea level in the Gulf, particularly the potential for sea level rise (SLR). A study by the U.S. National Oceanic and Atmospheric Administration Laboratory of Satellite Altimetry shows that between 1992 and 2008 global sea level has increased at the rate of 3.2 mm/year. This type of measurement is more reliable than land-based tide gauges, because of the tendency of many land areas to rise and/or fall as a result of tectonic influences (e.g., plate tectonics). A summary by the International Panel of Climate Change (IPCC, 2007) considered several scenarios for sea level rise by the year 2100. They were: B1 = 38 cm; A1B = 48 cm; and A1F1 = 50 cm. Scenario A1B, considered by some to be the most reasonable conclusion, assumed very rapid economic growth, with a global population that peaks in mid-century and there is a rapid introduction of new and more efficient technologies, at a balance across all sources. Scenario A2F1 is the same, but the use of fossil fuels continues to be intensive. As research on this topic continues at a rapid pace, hopefully more accurate predictions can be made.
Local Tectonic Influences
Another factor that impacts the actual potential sea level rise (SLR) along any shoreline is local tectonic influences (i.e., whether the land is rising or falling). There have been a number of studies that have dealt with land elevation changes around the Gulf area in the past 5,000 years, the time when sea level reached near its present level around the world (in the open ocean).
These numbers follow:
- (1) Qatar – Rising at rate of 1.1 mm/year (Vita-Finzi, 1982). Please be reminded that the present rate of SLR is 3.2 mm/year, so the rising land in this area only nullifies one third of the impact of SLR, assuming both factors remain relatively constant.
- (2) Al Jubail, Saudi Arabia – Rising at the rate of 0.3 mm/year (Ridley and Seeley, 1979).
- (3) Musandam Peninsula, Oman – Sinking at rate of 8.5 mm/year (Vita-Finzi, 1982).
- (4) Indian Ocean shoreline of Oman – Rising at rate of 0.35 mm/year (Hayes and Baird, 1993).
The rate we determined in Oman (near the UAE border) was based on measuring topographic beach profiles in which an “old raised beach ridge” presumably formed about 5000 years ago was 177 cm higher than the present high-tide line.
Clearly, the tectonic changes listed above are relatively minor compared to SLR, except for possibly along the Strait of Hormuz.
References Cited:
- Defense Mapping Agency, USA. 1975. Sailing directions for the Persian Gulf: Defense mapping agency, Hydrographic Center, Washington, DC, 352 pp.
- Dickinson, W.R. 1974. Plate tectonics and sedimentation. In: W.R. Dickinson, (ed.), Tectonics and Sedimentation. Tulsa: Society of Economic Paleontologists and Mineralogists, Special Publication 22, pp. l-27.
- Edgell, H.S. 2006. Arabian deserts: Nature, origin, and evolution. Dordrecht, The Netherlands, Springer, 592 pp.
- El-Baz, F. and R.M. Makharita. 1994. The Gulf War and the environment. Gordon and Breach Science Publishers S.A., Philadelphia, pp. 131-161.
- Hayes, M.O. and W.F. Baird. 1993. Shoreline erosional/depositional patterns in Oman. In: Coastal Engineering Considerations in Coastal Zone Management, American Society of Civil Engineers, NY, pp. 144-158.
- Hayes, M.O., E.R. Gundlach, and C.D. Getter. 1980. Sensitivity ranking of energy port shorelines. In: Proceedings of the Specialty Conference Ports ’80, American Society of Civil Engineers, Norfolk, VA, pp. 697-709.
- Hayes, M.O., J. Michel, and T.M. Montello. 1993. ROPME sea oil spill nearshore geochemical processes study. Volume 1. Distribution and weathering of oil in intertidal and subtidal sediments for year 1 (1992). Prepared by Research Planning, Inc. Marine Spill Response Corporation, Washington, DC, MSRC Technical Report Series 93-002.1, 230 pp.
- IPCC. 2007. Fourth assessment report of the intergovernmental panel on climate change. Cambridge University Press, Cambridge and New York.
- Jordan, T.E. 1981. Thrust loads and foreland basin evolution, cretaceous, western United States.
- American Association of Petroleum Geologists Bulletin, 65(12), 2506-2520.
- Lees, G.M. and N.L. Falcon. 1952. The geographical history of the Mesopotamian plains. Geographical Journal, 118, 24-39.
- Meteorology and Environmental Protection Administration (MEPA). 1987. An assessment of biotopes and coastal zone management requirements for the Arabian Gulf. MEPA Technical Report No. 5, Coastal and Marine Management Series, Kingdom of Saudi Arabia. 249p.
- Meteorology and Environmental Protection Administration (MEPA). 1991. Coastal surveys summary report. Unpublished report.
- Michel, J., M.O. Hayes, T.M. Montello, and T.C. Sauer. 1994. ROPME sea oil spill nearshore geochemical processes study: Distribution and weathering of oil in intertidal sediments for year 2 (1993). Prepared by Research Planning, Inc. Marine Spill Response Corporation, Washington, DC. MSRC Technical Report Series 94-009, 140 pp.
- Reynolds, R.M. 2002. Meteorology and climate, section 1: The Gulf ecosystem: Biogeophysical setting. In: N.Y. Khan, M. Munawar, and A.R.G. Price (eds.), The Gulf Ecosystem Health and Sustainability, Backhhuys Publishers, The Netherlands. 510pp.
- Ricketts, E.F.; J. Calvin; J.W. Hedgpeth, and D.W. Phillips. 1985. Between Pacific tides. Fifth Edition. Stanford, California: Stanford University Press, 652 pp.
- Ridley, A.P. and M.W. Seeley. 1979. Evidence of recent coastal uplift near al Jubail, Saudi Arabia. Tectonophysics, 52:319-327p.
- Research Planning, Inc. (RPI). 1977. Beach processes study: Master plan final report, Kuwait waterfront project. Research Planning Institute, Inc., Columbia, SC. Sasaki Assoc., Inc. Technical Paper 1, 53p.
- Research Planning, Inc. (RPI). 2003. Oiled shoreline survey in support of the marine and coastal damage assessment. Columbia, South Carolina, Research Planning, Inc. Publication, RPI 055/2003/008, 387p.
- Vita-Finzi, C. 1982. Recent coastal deformation near the Strait of Hormuz. In: Proceedings of Royal Society of London. A. Mathematical and Physical Sciences, 382(1783), 441-457.